
Monday, February 28, 2011
Dollar - Holding On!
The dollar is holding on around the 77 support line so far. It has been hovering there for a while, but breached it briefly today. Next is 76 which was the low back in November!

Sunday, February 27, 2011
Combination Screen - 2/25/2011 List
Given the market movement last week, it is not surprising that the list this week is limited to only 15 names since we screen for stocks within 95% of their 52 week high. This actually a feature of the list because in a down market there will be fewer names which will keep us in cash!

Once again, the top 10 are highlighted as the stocks are sorted by ascending Price-to-Sales ratio. I will use that list to rebalance the first list however, there are few survivors so this will be almost a complete turnover...
Once again, the top 10 are highlighted as the stocks are sorted by ascending Price-to-Sales ratio. I will use that list to rebalance the first list however, there are few survivors so this will be almost a complete turnover...
Combination Screen - 2/25/2011 Results
Here are the Combination Screen results for this week. This was not a great week as expectedly some people took some profits on the big winners and all the stocks on the list are at or close to their 52 week high.
2/1/2011 Screen
This is the original screen that is now 4 weeks old. I will not track this one on a weekly basis anymore as I had planned on rebalancing each screen after 4 weeks. But I will still check the results on a monthly basis for the next 5 months and see if the criteria have a long term impact on results.

This screen was hit the hardest this week, with the top 10 losing over 3%. The total screen is trailing the market over the last 4 weeks by 0.3%, but the top 10 are still up 3% more that the S&P for the last 4 weeks. Not too bad...
2/8/2011 Screen
I am tracking only the top 10% for the following screens. This screen was also hit hard last week. It still beats the market over the last 3 weeks, but barely.

2/15/2011 Screen
This screen did better than the 2 previous ones and is positive over 2 weeks while the S&P500 is in the red.

It is down to a couple big winners though!
2/21/2011 Screen
This is the screen from last week. This one did great last week but it is mostly due to the performance of PC Mall which is up 16% for the week. I guess sometimes it better to be lucky than good! The top 10% are down only 0.5% for the week when the overall market is down 3 times that.

2/1/2011 Screen
This is the original screen that is now 4 weeks old. I will not track this one on a weekly basis anymore as I had planned on rebalancing each screen after 4 weeks. But I will still check the results on a monthly basis for the next 5 months and see if the criteria have a long term impact on results.
This screen was hit the hardest this week, with the top 10 losing over 3%. The total screen is trailing the market over the last 4 weeks by 0.3%, but the top 10 are still up 3% more that the S&P for the last 4 weeks. Not too bad...
2/8/2011 Screen
I am tracking only the top 10% for the following screens. This screen was also hit hard last week. It still beats the market over the last 3 weeks, but barely.
2/15/2011 Screen
This screen did better than the 2 previous ones and is positive over 2 weeks while the S&P500 is in the red.
It is down to a couple big winners though!
2/21/2011 Screen
This is the screen from last week. This one did great last week but it is mostly due to the performance of PC Mall which is up 16% for the week. I guess sometimes it better to be lucky than good! The top 10% are down only 0.5% for the week when the overall market is down 3 times that.
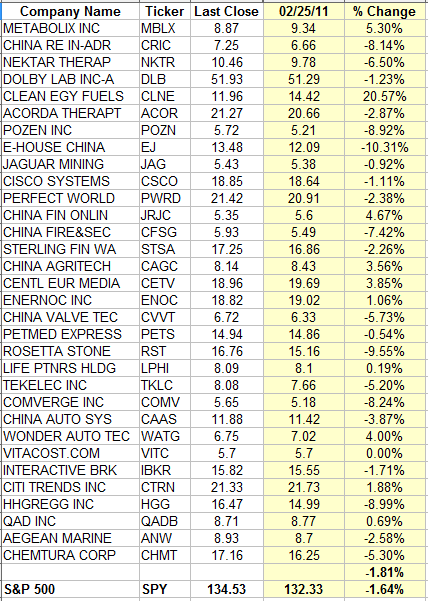
Stock to Short Screen - 2/25/2011 Results
This has not been a very satisfying experiment for a couple of reasons - the market is not cooperating with this screen by going up and secondly, I don't have much confidence in the screening parameters. I will keep on experimenting with it though to validate the current screen, but I will also be looking for other criteria to screen.
Screen from 2/15/2011
This was the first screen I ran. It trailed the market the previous week, but there were some big winners in the midst of the losers

History is repeating itself as the screen trails the market once again (not by much), but big winners spoil the party. CLNE for example is up over 20% for the week- no doubt a play on high oil prices. But there are other big movers... Over the last 2 weeks, the screen trails by around 0.6%.
Screen from 2/21/2011
Same story on this list. It trails the market, but big winners (CLNE was left over from the previous list).
I'll keep tracking both these lists for some more time and see if time ends taking its toll on these stocks.
And here is the latest list from the screen once again listed in descending order for the Price-to-Sales ratio,

Admittedly, by my own criteria, the bottom of the list where the Price-to-Sales ratio is below one could possibly be considered as undervalued. Might be some targets for bottom fishing as these stocks are certainly not expensive as compared to sales. I guess some more experimenting is needed!
Screen from 2/15/2011
This was the first screen I ran. It trailed the market the previous week, but there were some big winners in the midst of the losers
History is repeating itself as the screen trails the market once again (not by much), but big winners spoil the party. CLNE for example is up over 20% for the week- no doubt a play on high oil prices. But there are other big movers... Over the last 2 weeks, the screen trails by around 0.6%.
Screen from 2/21/2011
Same story on this list. It trails the market, but big winners (CLNE was left over from the previous list).
I'll keep tracking both these lists for some more time and see if time ends taking its toll on these stocks.
And here is the latest list from the screen once again listed in descending order for the Price-to-Sales ratio,
Admittedly, by my own criteria, the bottom of the list where the Price-to-Sales ratio is below one could possibly be considered as undervalued. Might be some targets for bottom fishing as these stocks are certainly not expensive as compared to sales. I guess some more experimenting is needed!
Thursday, February 24, 2011
Dollar - Danger Zone
The dollar has been bobbing and weaving between Fibonacci lines the past couple of weeks, but it is now again approaching a key support line around the low of late January. The next line of support is around 76 back in November!


Wednesday, February 23, 2011
Wheeeeeeat!
Food inflation resolved... All the grain futures have been hit in the last couple of days, but none worse than wheat.

Wheat is now down for the year after a $200 round trip! At $50 a point, some nice money was made or lost...
Wheat is now down for the year after a $200 round trip! At $50 a point, some nice money was made or lost...
Monday, February 21, 2011
Yes, Silver is Overpriced
I just ran an analysis on ChaosHunter and yes, it seems that in relationship to gold, silver is overpriced now. Here is the curve. The price of silver tracks the price of gold pretty will until the last couple of months. The divergence is the biggest it has ever been now. Could also be that gold is underpriced!

And for the statisticians, here are the stats:


And for the statisticians, here are the stats:
The Other Shiny Metal
While gold is grabbing all the headlines, silver is now on a parabolic rise.

The price is now at the top of the regression channel which should worry anyone invested in silver right now as prices usually tend to reverse to the trend.
Silver has already blasted through Fibonacci resistance lines from the previous correction. The $30 line held for a week, but is now strongly behind...

In case of a correction, here are the support lines. once again, $30 seems like the strongest support area.


The price is now at the top of the regression channel which should worry anyone invested in silver right now as prices usually tend to reverse to the trend.
Silver has already blasted through Fibonacci resistance lines from the previous correction. The $30 line held for a week, but is now strongly behind...
In case of a correction, here are the support lines. once again, $30 seems like the strongest support area.
Stocks to Short - 2/21/2011 List
Here is the list generated by my Stocks to Short screen. Based on the results from last week, I would very hesitant to short any of these stocks while the market is still rising as it is. The list did trail the market by 0.5% last week which is encouraging, but some of the stocks were big winner. It is always dangerous to short stocks as the bottom since the slightest bit of good news can generate an overreaction!

The stocks are ranked in descending order of Price-to-Sales. I'll track the results next week!
The stocks are ranked in descending order of Price-to-Sales. I'll track the results next week!
Sunday, February 20, 2011
Combination Screen - 2/18/2011 List
Here is the latest list from my combination screen. Once again, ranked by Price-to-Sales. I will track the performance of the top 10 only for this list.

There are 102 stocks in the list, but I list only the top 80 here... As the market makes new high, more and more stocks also make new high so the list is growing every week! The top 10 are highlighted in yellow. I will track these stocks over the next 4 weeks.
There are 102 stocks in the list, but I list only the top 80 here... As the market makes new high, more and more stocks also make new high so the list is growing every week! The top 10 are highlighted in yellow. I will track these stocks over the next 4 weeks.
Screen Results - 2/18/2011 Update
Time to update the screens for this week. I am now tracking 3 versions of the combination screens (one for each of the last 3 weeks) and I will also update the test screen of stocks to short. I will present the new list for the screen in another post later today.
January 31 List
To begin with, here is the first screen from 3 weeks ago. Since this is the original screen that I will rebalance on a monthly basis, I track the entire portfolio. For the other weekly list, I will track only the top 10 as ranked by the Price-to-Sales ratio since my testing has shown it to be the best criteria.

Over the last 3 weeks, the entire list is up 5.37% as opposed to 4.73% for the broader market as represented by SPY. The list was up 1.94% last week along as opposed to 1.07% for SPY. The top 10 (ranked by Price-to-Sales) is nothing short of great. Up 2.32% for the week and 9.44% over the last 3 weeks. It beats the market by over 4%. Next week is the last week for this entire list as I will rebalance the portfolio. I suspect that there will be some heavy turnover! But the goal is to maximize performance, not hold stocks for a long time!
February 7 List

The list created 2 weeks ago also had a good week. To save time, I am tracking only the top 10 for the weekly list. Last week, these 10 stocks were up 2.47%, beating the market by close to 1.5%. They are up 4.46% for the last 2 weeks, up close to 2% over SPY.
February 14 List

This week is only a week old. And once again, it beat the market pretty handily for the week, up 2.63% as compared to 1.07% for SPY.
There seem to be a pattern emerging here as newer list outperform the older list in perfect order. Something to track over the next months!
Stocks to Short List
Well, a rising tide lifts all boats... Even though I tried picking stocks that are close to their 52 weeks low ranked with descending Price-to-Sales ratio, the entire list did manage to stay positive. It did underachieve the broader market though by around 0.5%. This would be a better list to track in a correction. Unfortunately, none on the horizon so far....

That is is for the current screen... A very good week overall!
January 31 List
To begin with, here is the first screen from 3 weeks ago. Since this is the original screen that I will rebalance on a monthly basis, I track the entire portfolio. For the other weekly list, I will track only the top 10 as ranked by the Price-to-Sales ratio since my testing has shown it to be the best criteria.
Over the last 3 weeks, the entire list is up 5.37% as opposed to 4.73% for the broader market as represented by SPY. The list was up 1.94% last week along as opposed to 1.07% for SPY. The top 10 (ranked by Price-to-Sales) is nothing short of great. Up 2.32% for the week and 9.44% over the last 3 weeks. It beats the market by over 4%. Next week is the last week for this entire list as I will rebalance the portfolio. I suspect that there will be some heavy turnover! But the goal is to maximize performance, not hold stocks for a long time!
February 7 List
The list created 2 weeks ago also had a good week. To save time, I am tracking only the top 10 for the weekly list. Last week, these 10 stocks were up 2.47%, beating the market by close to 1.5%. They are up 4.46% for the last 2 weeks, up close to 2% over SPY.
February 14 List
This week is only a week old. And once again, it beat the market pretty handily for the week, up 2.63% as compared to 1.07% for SPY.
There seem to be a pattern emerging here as newer list outperform the older list in perfect order. Something to track over the next months!
Stocks to Short List
Well, a rising tide lifts all boats... Even though I tried picking stocks that are close to their 52 weeks low ranked with descending Price-to-Sales ratio, the entire list did manage to stay positive. It did underachieve the broader market though by around 0.5%. This would be a better list to track in a correction. Unfortunately, none on the horizon so far....
That is is for the current screen... A very good week overall!
Tuesday, February 15, 2011
Reverse Combination Screen
As an experiment, I want to see if the reverse criteria of my combination screen would create a nice list of stocks to short. So I have screened for stocks within 5% of their 52 weeks low, trading at more than $5 (I don't want penny stocks) and ranked them based on Price-to-Sales but in descending order in order to get the worse ones at the top. Here is the list for today:

I will track this portfolio as well over the coming weeks and run the screen every week!
I will track this portfolio as well over the coming weeks and run the screen every week!
Monday, February 14, 2011
Relentless Market
There is no end to this upward move! Where are the support points now. Let's look at the chart:

The strongest support level is actually around the 50% retracement point at 119 or so. Then there are 3 minor ones around the only small technical pullbacks of the last 6 months (unreal!). 2 of them are around the 126 level which is one of the Fibonacci levels as well so that would be the first logical stop for a correction.

The strongest support level is actually around the 50% retracement point at 119 or so. Then there are 3 minor ones around the only small technical pullbacks of the last 6 months (unreal!). 2 of them are around the 126 level which is one of the Fibonacci levels as well so that would be the first logical stop for a correction.
Dollar Today!
Here is another chart of the dollar as of today.

I am using the January high and February low for a new Fibonacci retracement analysis. Again, levels that provided support on the way down (green circles) should provide resistance on the way up (red circles).
I am using the January high and February low for a new Fibonacci retracement analysis. Again, levels that provided support on the way down (green circles) should provide resistance on the way up (red circles).
Sunday, February 13, 2011
Screen Results - How to Improve the Performances
I have tried to sort out the results from the lists generated the last 2 weeks by the Combination Screen and here are some thoughts. At first I tried combining all the fundamentals numbers into one rating and applying it to rank the stocks in the list. The first week, it generated results that beat that overall list but not by much. And it did not carry over to this week. I tried using a technical rating based on multiple technical indicators, but so far, I cannot find a correlation. Then I went back to the books that inspired the screen to begin with and remembered the fundamental criteria that was cited more often - Price-to-Sales. As an experiment, I ranked the stocks by the Price-to-Sales ratio in ascending order and analyzed the numbers. Not surprisingly (in hindsight), this makes a big difference! Here are the results:

After the first week, the top 10 stocks in the list (highlighted in yellow in the list) are up an average of 5.93% with only one loser. This beats the market by 3.83%. After 2 weeks, the top 10 are up 6.99%, beating the market by 3.36% so losing some ground. But it is expected after such results in the first week! Still some very big winners and only 2 losers (20%). Not bad...
Seeing the first week results, I went back to the list generated by the screen last week and ranked the stocks by their Price-to-Sales ratio again and again, they beat the market average.

The overall market was up by 1.49% last week, but the top 10 on the list were up 1.89%. Not as good as the first set of stocks, but still noticeable. But 3 losers out of the 10.
This is something worth monitoring over the long run! This is the reason why I listed the screen results for this week in ascending order of the Price-to-Sales ratio. I will keep on monitoring the results based on that criteria as well.
Also, the set of data generated by the screen is not representative enough to do a complete analysis so my plan now is to try to find a correlation between fundamental values and performance over 6 months to a year. I will generate a much larger list, track the performance and analyse the results on a monthly basis! More on this in a later post.

After the first week, the top 10 stocks in the list (highlighted in yellow in the list) are up an average of 5.93% with only one loser. This beats the market by 3.83%. After 2 weeks, the top 10 are up 6.99%, beating the market by 3.36% so losing some ground. But it is expected after such results in the first week! Still some very big winners and only 2 losers (20%). Not bad...
Seeing the first week results, I went back to the list generated by the screen last week and ranked the stocks by their Price-to-Sales ratio again and again, they beat the market average.
The overall market was up by 1.49% last week, but the top 10 on the list were up 1.89%. Not as good as the first set of stocks, but still noticeable. But 3 losers out of the 10.
This is something worth monitoring over the long run! This is the reason why I listed the screen results for this week in ascending order of the Price-to-Sales ratio. I will keep on monitoring the results based on that criteria as well.
Also, the set of data generated by the screen is not representative enough to do a complete analysis so my plan now is to try to find a correlation between fundamental values and performance over 6 months to a year. I will generate a much larger list, track the performance and analyse the results on a monthly basis! More on this in a later post.
Screen Results - 2/11/2011 Update
Here is a follow up on the list that I started with on 1/31/2011. Overall, the list is now lagging the broad market average.

The list was up 0.87% for the week as opposed to 1.49% for the S&P500 and is up 3.39% for the last 2 weeks as opposed to 3.63% for the S&P500. Not bad results, but disappointing after the first week results where it beat the market by 0.3%. There are some good winners in there and also some losers. KEM, TU and NZT are some of the losers that are affected by disappointing earnings reports. On the other hand, NZT pays close to a 10% dividend so that helps! So does NRF which is also lagging! Jim Chanos mentioned this week that he short all the integrated oil company and in particular Royal Dutch Shell as he says that they are eating their seed corn paying dividend. Not sure if it had an impact, but it is also one of the worst performing stocks in the list. All these stocks are undervalued compared to the market in general so I have to assume that they will weather any correction better than that broad market average. We'll see over the coming weeks as I continue monitoring the list.
The list was up 0.87% for the week as opposed to 1.49% for the S&P500 and is up 3.39% for the last 2 weeks as opposed to 3.63% for the S&P500. Not bad results, but disappointing after the first week results where it beat the market by 0.3%. There are some good winners in there and also some losers. KEM, TU and NZT are some of the losers that are affected by disappointing earnings reports. On the other hand, NZT pays close to a 10% dividend so that helps! So does NRF which is also lagging! Jim Chanos mentioned this week that he short all the integrated oil company and in particular Royal Dutch Shell as he says that they are eating their seed corn paying dividend. Not sure if it had an impact, but it is also one of the worst performing stocks in the list. All these stocks are undervalued compared to the market in general so I have to assume that they will weather any correction better than that broad market average. We'll see over the coming weeks as I continue monitoring the list.
Combination Screen - 2/11/2011 List
I have not been posting at all this week as I was sick! But back to the keyboard again.... Here is the list of stocks passing the screen criteria as of Friday. I have copied only the first 70 as the list now has over 80 names! I will have another post on some research I have done to screen out the best candidates later. This list is sorted on the Price-to-Sales ratio.

Monday, February 7, 2011
Combination Screen - 2/7/2011 List
For anyone looking to test my fundamental combination screen, here is the list as of this afternoon. This one is quite large and will probably need to be weeded out. I am thinking of adding a volume criteria as well as a price one to remove stocks below $5.00.

As before, this is not a recommendation, just a starting point!
As before, this is not a recommendation, just a starting point!
Saturday, February 5, 2011
Scren Results - 2/5/2011 Update
I ran a first screen using criteria described in a my first article on fundamentals on Monday. The results of the screen can be found in this post. At this point, it is just an experiment - there is no money riding on this one! But one week later, I wanted to check how it fared against a strong market this week. Here are the results:

Some big winners (KELYA, BGC and ARW) and also some losers. KEM lost some grounds on disapointing earnings this week for example! It's always risky to invest around earnings announcements, but this screen did not take earning dates into account so we'll live (and die) with that. Overall, the screen beats the market by 0.23%. Not a bad start...
I'll check again in one week and plan to rebalance every month. I will also setup other screens using some other criteria and screen described in other posts. I will track these as well.
Thursday, February 3, 2011
Why Can't IWM get over 80 (or 800 on the RUT)?
The Dow is over 12,000, the S&P is over 1300, why does the RUT have so much trouble getting over 800? On a psychological level, 800 seems like the next hurdle, but the if you look at the recent correlation between the Dow and the Russell index, it makes more sense.


Since the lows of March 2009, IWM has had a much better run than the Dow so while 800 is big round number, it seems that compared to a historical valuation, IWM is overvalued by close to 100 points (or the Dow undervalued - right!). In any case, IWM needed a breather to let the Dow catch up to more historical valuation. Do don't sweat the round numbers. It's in your head only!

Pair Trading - EWG and EWQ
Someone on Phil's Stock World suggested an interesting pair trade - EWG (the iShare Germany Index) and EWQ (the iShare France Index). I ran an analysis using ChaosHunter and found a very strong correlation betweent the 2 indices. But it seems that EWQ is now relatively undervalued compared to EWG.

The model suggests a predicted value for EWQ of over $30 but the ETF currently trades around $26. Here are the stats for the model as reference:

I tested from 2001 on to today, using the first 8 years to optimize and 2010 as an out of sample data set. Here is the graphs for all rows. The correlation is indeed pretty strong.


The model suggests a predicted value for EWQ of over $30 but the ETF currently trades around $26. Here are the stats for the model as reference:
I tested from 2001 on to today, using the first 8 years to optimize and 2010 as an out of sample data set. Here is the graphs for all rows. The correlation is indeed pretty strong.

Dollar Today - Real Bounce or Dead Cat Bounce?
I am really going to start believing these Fibonacci retracements. Here is an updated daily chart for the dollar future.
 As you can see, the greenback is bouncing off the last retracement line - 78.6%. Uncanny to say the least. At the same time, the dollar bounced off previous support line only to slice through them a couple of days later! Which way his way?
Wednesday, February 2, 2011
Fundamentals - What to Screen For (Part 2)
In a previous post I outlined some fundamentals that you can screen for to look for quality stocks. That set of values was the one that stood out for me out of the 2 books that that mentioned. However, in his book (Your Next Great Stock ), Jack Hough outlines other factors that are sometimes ignored. Here are a couple more.
Accruals (from Free Cash Flow and Earnings)
Most investors are stuck on looking at earning, but as we saw in the last post, earning can be manipulated. In addition, earnings do not necessarily represent how much cash a company is adding to the kitty box due to the rules of accounting used by all businesses - accruals accounting. Under these rules, income is added as it is accrued (not when it is collected) and expenses are subtracted as they are incurred (not when they are paid). In his book, Hough uses the example of his barber who starts accepting credit cards - he might sell $2000 of services per week as usual, but if 1/2 his clients use credit cards to pay, he'll have only $1000 in his kitty box until he gets paid by the credit card company. But he can still count on $2000 of income. It gets trickier with large businesses depreciating and amortizing large equipment or software as payment are counted over many years even if made in one shot! Hough outlines ways that businesses can use accruals to boost their numbers. Obviously, something to always keep in mind. Next Hough outlines a strategy to look for something a bit counterintuitive - to look for companies with negative accruals. Accruals are calculated by subtracting free cash flow from earnings. His argument (supported by many studies) is that companies with negative accruals usually have hidden earnings while companies with positive accruals might actually be inflating earnings. He cites in particular a couple studies from Richard Sloan (an accounting professor at U. of Michigan) who found out that a portfolio which bought companies with negative accruals and shorted companies with positive accruals beat the broad market by 10% a year between 1962 and 1991. Sloan published another article supporting his research a couple years back and showed again that companies with high accruals showed poor earnings moving forward. Sloan's findings have been put to work by many institutional investors and hedge fund and they are now called the accrual anomaly. In 2006 Joshua Livnat (a professor at NYU) and Massimo Santicchia (of S&P Investment Services) found that the anomaly still yielded positives results despite the fact that large investors were actively trading using it. They also discovered that the accrual anomaly was stronger with smaller to mid-size companies. Now, accruals are not usually listed in most financial web site, but it can be calculated if your screener shows Free Cash Flow and Earnings. Hough suggests looking for companies whose trailing 12-month free cash flow minus trailing 12-month net income is greater than zero. In his screen he adds other factors, but feel free to add any of the factors described in the other post.
Insider Buying
Executives willing to eat their own cooking can be a decent predictor as long as you know what to look for. In his book, Hough goes to great length to explain insider buying. This is sometimes a tricky subject as the reasons for the buying are not always black and white - a canny executive might be accumulating shares to consolidate his position for example. But most often, they have a better understanding of their businesses than the public at large. Obviously, for them to trade on nonpublic information is illegal, but it is a gray area as to what is nonpublic! In any case, Hough outlines a study that was done by Citibank in 2006 on insider transactions done in the UK. The analysts were looking for factors that affected the stock price after that transactions took place. The factors were:
Interestingly enough, Hough does not elaborate on insider selling. I would be curious to see if it has the reverse effect on the stock price! Maybe someone has published a study on that.
Accruals (from Free Cash Flow and Earnings)
Most investors are stuck on looking at earning, but as we saw in the last post, earning can be manipulated. In addition, earnings do not necessarily represent how much cash a company is adding to the kitty box due to the rules of accounting used by all businesses - accruals accounting. Under these rules, income is added as it is accrued (not when it is collected) and expenses are subtracted as they are incurred (not when they are paid). In his book, Hough uses the example of his barber who starts accepting credit cards - he might sell $2000 of services per week as usual, but if 1/2 his clients use credit cards to pay, he'll have only $1000 in his kitty box until he gets paid by the credit card company. But he can still count on $2000 of income. It gets trickier with large businesses depreciating and amortizing large equipment or software as payment are counted over many years even if made in one shot! Hough outlines ways that businesses can use accruals to boost their numbers. Obviously, something to always keep in mind. Next Hough outlines a strategy to look for something a bit counterintuitive - to look for companies with negative accruals. Accruals are calculated by subtracting free cash flow from earnings. His argument (supported by many studies) is that companies with negative accruals usually have hidden earnings while companies with positive accruals might actually be inflating earnings. He cites in particular a couple studies from Richard Sloan (an accounting professor at U. of Michigan) who found out that a portfolio which bought companies with negative accruals and shorted companies with positive accruals beat the broad market by 10% a year between 1962 and 1991. Sloan published another article supporting his research a couple years back and showed again that companies with high accruals showed poor earnings moving forward. Sloan's findings have been put to work by many institutional investors and hedge fund and they are now called the accrual anomaly. In 2006 Joshua Livnat (a professor at NYU) and Massimo Santicchia (of S&P Investment Services) found that the anomaly still yielded positives results despite the fact that large investors were actively trading using it. They also discovered that the accrual anomaly was stronger with smaller to mid-size companies. Now, accruals are not usually listed in most financial web site, but it can be calculated if your screener shows Free Cash Flow and Earnings. Hough suggests looking for companies whose trailing 12-month free cash flow minus trailing 12-month net income is greater than zero. In his screen he adds other factors, but feel free to add any of the factors described in the other post.
Insider Buying
Executives willing to eat their own cooking can be a decent predictor as long as you know what to look for. In his book, Hough goes to great length to explain insider buying. This is sometimes a tricky subject as the reasons for the buying are not always black and white - a canny executive might be accumulating shares to consolidate his position for example. But most often, they have a better understanding of their businesses than the public at large. Obviously, for them to trade on nonpublic information is illegal, but it is a gray area as to what is nonpublic! In any case, Hough outlines a study that was done by Citibank in 2006 on insider transactions done in the UK. The analysts were looking for factors that affected the stock price after that transactions took place. The factors were:
- Large stock purchases - Bigger purchases would predict better returns but purchases too large (as a percentage of the float) had actually the opposite effect.
- Who made the stock purchases - Executives has more impact than board members.
- Numbers of executives making a stock purchase
- Size of the companies - Stock purchases in smaller company with little analyst coverage did better.
- Timing - A stock purchase following an earning surprise was a good predictor. In addition, purchases made while a stock had a strong performance was usually a good sign.
Interestingly enough, Hough does not elaborate on insider selling. I would be curious to see if it has the reverse effect on the stock price! Maybe someone has published a study on that.
Tuesday, February 1, 2011
Amazon vs. Netflix
Well, it seems that Amazon (AMZN) is ready to enter into battle with Netflix (NFLX) in the streaming video arena. You can try to pick a winner, but in this book, they both seem expensive based on their fundamentals. I just wrote a post yesterday regarding the items to screen for when looking for stocks so let's put the research to work. Let's look at the numbers first:

NFLX is seen as having a bit more growth potential with a PEG of 1.69, but neither of them would show up in my screen as they are both over 1.5. Price/Sales and Price/Book are decidedly on AMZN side, but neither number would qualify them for my screen either! Price momentum on the other side would qualify only NFLX since I screen for 95% or over.
Looking at other 2 ratios not used in my screen, but still useful, you can see that both have P/E that will be hard to justify in the coming years. Price to Cash Flow is way out of whack for Amazon (?) and a tad expensive for Netflix but not overly for a growth stock.
Overall, not a great picture! Both are definitely overpriced. But don't go shorting either one of them. AMZN has killed many shorts and NFLX is not a fun one to short either...
Keep in mind that NFLX uses AMZN infrastructure for streaming its video so in a sense, Amazon is already collecting a dime from Netflix every time you watch a rerun of Lost trying to figure out what you have missed!
Food Riots!
Want to know what people are in the streets rioting about food prices. Look at the futures for corn and wheat.
Corn

Making a 52 week high today and up 84% since last August.
Wheat

Not quite at the 52 week high (we made that 3 days ago) but also up close to 60%. Big bump last year on the Russian fires, but we are trading right around that price now.
No inflation, right!
Corn

Making a 52 week high today and up 84% since last August.
Wheat

Not quite at the 52 week high (we made that 3 days ago) but also up close to 60%. Big bump last year on the Russian fires, but we are trading right around that price now.
No inflation, right!
Fundamentals - Screen Results 2-1-2011
Just for fun, I ran a custom screen on Zacks using the criteria described in my previous post. I added the condition that the stock had to be optionable to be able to add leveraged plays. And cutoff the P/B criteria at 2.0 to limit the list. Here are the results:

This is by no means an endorsement to go out and buy all these stocks. I'll try to track the results over a a couple of months.
This is by no means an endorsement to go out and buy all these stocks. I'll try to track the results over a a couple of months.
Subscribe to:
Comments (Atom)