Tuesday, December 16, 2014

VIX and Proxy ETFs

Following my post on gold and proxies, I wanted to investigate another instrument where proxy ETF get some interesting results - the VIX. To begin with, here is a quick interpretation of the VIX from Wkipedia:

http://en.wikipedia.org/wiki/VIX
The VIX is quoted in percentage points and translates, roughly, to the expected movement (with the assumption of a 68% likelihood i.e. one standard deviation) in the S&P 500 index over the next 30-day period, which is then annualized. For example, if the VIX is 15, this represents an expected annualized change, with a 68% probability, of less than 15% over the next 30 days; thus one can infer that the index option markets expect the S&P 500 to move up or down 15%/√12 = 4.33% over the next 30-day period.[6] That is, index options are priced with the assumption of a 68% likelihood (one standard deviation) that the magnitude of the change in the S&P 500 in 30-days will be less than 4.33% (up or down).
The price of call and put options can be used to calculate implied volatility, because volatility is one of the factors used to calculate the value of these options. Higher (or lower) volatility of the underlying security makes an option more (or less) valuable, because there is a greater (or smaller) probability that the option will expire in the money (i.e., with a market value above zero). Thus, a higher option price implies greater volatility, other things being equal.
The VIX is very important as it does give us a window on the traders' sentiment. It's not perfect as with many indicators, it lags since it derives from a reaction to current conditions and therefore does not necessarily reflect what will happen in the future. It is a matter of fact, the VIX which is supposed to measure volatility suffers itself from excessive volatility making it difficult to trade.

Speaking of trading, you cannot trade the VIX directly but you have to use futures if your broker offers it or options. Trading options on the VIX is notoriously risky as they do not track the VIX itself (which is not traded) but futures.  Here is a good article on VIX options:

http://sixfigureinvesting.com/2010/01/trading-vix-options/

The alternative to trading futures and options are ETFs and many of them have been constructed around VIX futures. Here are the ones that I am investigating in this post:

Long:
TVIX - VelocityShares Daily 2x VIX ST ETN (leveraged)
VXX - iPath S&P 500 VIX ST Futures ETN
UVXY - ProShares Ultra VIX Short-Term Futures (leveraged)
VXZ - iPath S&P 500 VIX MT Futures ETN

Short:
XIV - VelocityShares Daily Inverse VIX ST ETN
SVXY - ProShares Short VIX Short-Term Futures

My first look at long term performance was most revealing and what led me to write this post. I had some inkling about at least one ETF, VXX as I write extensively about it on Phil's Stock World. However, I was not aware of the extent of the problem for some of these ETFs.

Looking at the earliest date where all these ETF existed, here are the performances:


Clearly, the VIX has lost 50% since that date so it is expected that long VIX ETFs will suffer. But they just don't suffer, they get obliterated. Looking closely at the results, some of these ETFs are now worth around 1% of their original value and it's a matter of fact, some of them have been reset a couple of times already. On the other hand, short VIX ETFs have done tremendously well, up about 450% in about 3 years. And some good stops strategy would have yielded much better gains.

To be faire, let's look at a period where the VIX ended up higher than at the beginning of the chart:


So now we see a period where the VIX is 60% higher at the end of the period than it was when we start tracking performance and yet long VIX ETFs are once again killed with the leveraged ETFs suffering catastrophic losses. Short VIX ETFs still show a profit despite the fact that the VIX is actually higher. 

Looking at the underlying instrument, it's easy to understand the problem. The VIX shows some quick spikes up followed by long quiet periods where it loses value. As opposed to stocks (well most of them at least), there is no possible long term appreciation of the VIX. It is basically an indicator. It cannot be used as a long term investment instrument. It is meant to be traded over short term periods. The problem with all these ETFs is that like some that we looked at for oil, they are constructed around futures which need to be rolled over from month to month and suffer from decay if the underlying instrument does not go in the direction of the ETF. And since the VIX itself cannot be relied to go up over long time periods, these long ETF have no chance in the long run.

Let's look at shorter term scenarios to see where some of these ETFs could be used as trading substitutes. Let's first pick a short term period where the VIX goes lower and look at the performances:


Over this time period (about 5 weeks), the VIX loses 20% of its value. The short ETFs do their job and gain close to 30% over that time period. I suspect that they have very similar holdings as they move so close to each other in the short term. I could not pick one over the other. 

Clearly, the leveraged VIX ETF lose much more, over 40%. Somewhat expected when you are leveraged 2x. VXX loses more than the VIX itself, but once again, it's only decay doing its work there. VXZ seems to be holding up better and it did in fact get the best performance of these long ETFs in the long term. Not sure why and I don't have the exact holdings to make comparisons. 

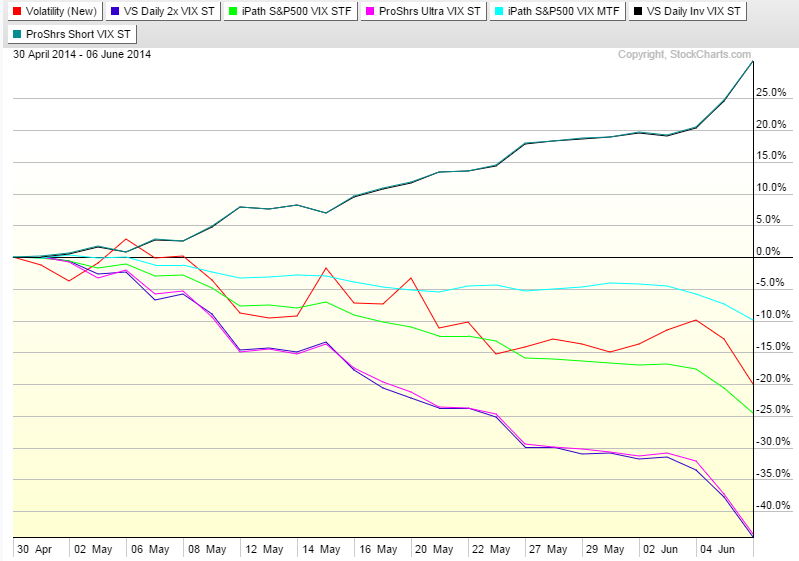
Now lets look at a period where the VIX gains value:


This chart does explain quickly the long term results. Even though the VIX is up 37% over that 5 weeks period, the short ETFs are only down 20%. But look at the long ETFs! What is going on with the leveraged ETFs - they barely keep up with the VIX and end up 5 to 10% lower. Looking at the results over a down period, you would expect them to over perform when the VIX goes higher. But that is not the case. Looking at the standard ETFs, they lag the underlying instrument by 20 to 30%. Not what you would expect either. Very disappointing.

So, if these long ETFs cannot keep up when the VIX ramps up but lose more value when the VIX goes down, what is the point in even owning them for the long run. Even in the shorter run, they don't seem to perform as expected. Short ETFs clearly outperform on both sides on the equation. They seem to match the VIX on the down side and are more resilient when conditions are not ideal. This does explain the long term results given the fact that the VIX goes down for longer periods.

Conclusion

This post looks at periods covering weeks at a time, not hours. In addition, I have looked at only a couple of periods. This is not an exhaustive study. Maybe a topic for another post. In the case of the leverage long ETFs, my feelings are that they are better treated as trading instruments for periods of hours to days. They clearly underperform the underlying instrument by a wide margin in the long term. The only drawback is that these instruments are not ideally suited to be used as hedges for a larger portfolio where the holding period has to be measured in weeks. There has to be better alternatives.

The short VIX ETFs make an interesting case of longer term investment. It's difficult to say if the last 3 years are indicative of what we will see in the next 3 years. But even at higher levels, the VIX still follows a nice pattern of quick burst higher and quieter periods thereafter which benefits these short ETFs. In any case, they also seem to make more reliable trading instruments as they mimic the moves of the underlying instrument better.

Sunday, December 14, 2014

Oil Trade Proxies

We had an interesting discussion on Phil's Stock World last week regarding trades around the oil sell off and a possible rebound. Some of the members where looking at different instruments (leveraged and non-leveraged) and that perked my interest enough that I wanted to do some back testing around these instruments.

In order to do some testing, I needed to first look at some signals that could be used for trades. In order to keep it simple, I settled on MACD in a weekly view. This might not be the ideal indicator (it's lagging), but it's gives good enough signals for the purpose of our testing. Here is the chart that I generated:


The vertical lines indicate the weeks where we reverse our position from long and to short and vice-versa. There are some pretty good signals there and once again as usual in trading, it comes down to position size and managing your stops. The instruments that I wanted to backtest are ETFs. Some are leveraged 2x or 3x, others are non-leveraged. There are ETF build around oil futures like USO and the leveraged UCO and SCO while others hold energy company stocks like XLE and OIH. There are also leveraged versions (long and short) of Oil and Gas industry - DIG and DUG. While not exact replicates of OIH, they perform in similar ways sometimes as we will see.

Looking at long terms results using non-leverage ETF, we get the following performance chart:


The first fact that appears on this chart is that USO makes a very bad proxy for a long term oil position. Even though oil is now down as compared to its 2006 levels, USO is down 50% more. It's most likely the result of decay from having to roll futures from month to month. So, even if you have a long term bullish view on oil, it is tough to justify using USO as a proxy. It's clear that on a long term basis, XLE (green) makes the better proxy. The only issue is that like most US equities, it seem to have overextended itself since mid-2013 when it somewhat disconnected with oil prices. The oil services ETF (OIH - pink) seems to have a close correlation, but suffered in 2011 and 2012 and didn't recover. However, it has not been as bad as USO and might possibly have the most ground to make up on recovery.

Overall though, as with many commodities, oil is better traded than invested in. The choices are to trade futures on short term charts (down to minutes) or longer term with proxies on weekly chart like the one above.

For this study, I want to concentrate on the following periods because they show some interesting results:

Period 1: May 9. 2011 to October 24, 2011 - Short
Period 2: October 24, 2011 to April 2, 2012 - Long
Period 3: September 30, 2013 to February 10, 2014 - Short
Period 4: February 10, 2014 to July 21, 2014 - Long
Period 5: July 21, 2014 to Today - Short

Results for Period 1 - Short


During that period, oil was down as much as 32% and finished the period down about 18%. Interestingly enough, the non-future based ETF XLE and OIH lagged the downside move but abruptly caught up in August 2011. But this also a month where the overall market suffer a large loss so looking at oil only doesn't convey the complete picture. In essence, XLE and OIH are proxies for equity market with a strong influence from oil it seems. On the other hand, for that short term period, USO makes a pretty faithful proxy, down only a couple more percent that oil itself.

The following chart adds the leveraged short ETF:


Clearly, SCO is a winner in the long run, up about 27% at the end of the period while oil is down 20%. Managing your position with some stops could have yielded some very interesting gains, but even 27% is a nice returns for 6 months. But it does seem that decay takes a bite out of the returns in the long run as the 2x ETF doesn't return that percentage in the end. But overall, some nice gains. DUG pretty much follows OIH but the mix is not perfect as the final return of 10% doesn't reflect the losses in OIH. 

Results for Period 2 - Long


During this period, oil is up about 12% and again, USO is a faithful proxy, only down over 1% as compared to oil for the same period. XLE and OIH on the other hand recovered slower, following the equity markets. It was actually the beginning of a downtrend for OIH as outlined above.

Adding the leveraged ETF, we get the following results:


Double-leverage with UCO this time is again the winner and could have yielded some good returns with good position management. But there again, the decay associated with leveraged ETF is starting to make a difference at the end, with the 2x ETF yielding only about 1.5x the underlying instrument. But 16% return over 5 months is not bad! $10,000 invested in the 2x leveraged ETF at the beginning of Period 1 would have returned $14,732.00 at the end of Period 2 (less than one year). And that is without additional leverage like options! DIG doesn't make a very good proxy at all because it is plagued by the poor performance of the oil industry in general.

Results for Period 3 - Short


Once again, we see a disconnect between the industry based ETF like XLE and OIH and the price of oil. USO proves again to be a good proxy for short term periods. As seen in the long term chart at the beginning of the article, OIH is overall more sensitive to the oil prices than XLE. It's partially the case because XLE is made up of integrated oil giants like XOM or CVX who can partially benefit from lower oil prices with their chemical divisions. 

Adding the short leverage ETF, we get the following results:


Not surprisingly given the fact that XLE and OIH stayed somewhat above water, DUG performed opposite what it was expected. SCO is a winner again and again, we can see the results of decay toward the end of the period. 

Results for Period 4 - Long


Some very interesting results in this period. The signal tells us to go long but in fact, oil prices stay flat. For some reason, USO actually outperform the underlying commodity but we would need to look to see if oil prices were in contango or backwardation to have a better idea since USO is based on futures with various expirations. XLE and OIH take off about 20% in that time period, but probably influenced by the equity markets rather than oil prices.

The results with the leveraged ETF is as follows:


As expected given the performance of OIH and XLE, DIG takes off like a rocket and returns over 30% in 5 months. But even UCO shows a profit of close to 8% despite oil being flat. 

Results for Periods 5 - Short


The current period shows a large down move by oil, down over 42% in 5 months. Clearly not a standard correction! This time, OIH follows the price of oil almost step for step. USO is again a decent proxy although showing more resilience at time. XLE is clearly supported by a strong equity market.

The results with the leveraged ETF is shocking:


Sure, decay might take a bite out of the performance eventually but who cares with a current return of 160%! DUG is also showing a nice return following the disappointing OIH.

Conclusion

As pointed out above, I don't see oil as a long term investment, more like a trading instrument. But rather than dealing with futures which require a full time trading job, I wanted to explore some possible proxies that would allow for more simple and still profitable trades. USO is generally seen as the best proxy for oil and it does prove to be that way for medium term trades. If you are bullish oil on the long term though, USO is not the instrument you want as it does decay with the underlying futures. For long term investment, you are probably better off with XLE although OIH could see more appreciation in the medium term since many of its components are currently very cheap. But not without risks as some could face difficult times financially if oil doesn't recover quickly.

For medium term trades, you probably should look at the leveraged oil ETF like UCO and SCO. They clearly show some great results over multiple months but do suffer from decay as well. As it is, they should not be seen as long term trading instruments. DIG and DUG show potentially good returns, but as proxies for XLE and OIH rather than the oil price itself.