
Thursday, December 15, 2016
Sunday, January 11, 2015
S&P 500 Leverage and Hedges Options - Part 2
In my last post (Part 1 of this article), I looked at alternative ETFs that could be used as hedges against the corrections that we have seen during that long 2 year bull run. Looking at the results, it seems that for short (less than a month) corrections, a VIX ETF like VXX could actually be a viable candidate to hedge or speculate on the way down. Another alternative ETF was TMF, a long Treasuries ETF which banks on the fact that when markets go down, money tends to pack into treasuries viewed as safe instruments. In some cases, TMF even outperformed the usual hedging instruments like leveraged ETFs. There could of course be other factors at play since some of 2014 corrections were related to geopolitical events which are certainly positive for the Treasuries market. In times of uncertainty, nothing sounds safer than US Notes and Bonds. Dollar based ETFs were too inconsistent to be considered for hedging although they generally beat the market during these corrections.
In this post I want to look at instruments that should do well in the long periods where the market was up. The idea is once again to leverage your assets by investing in instruments that will beat the market by a large margin. I am not looking at derivative instruments like futures or options which can add leverage to already leveraged instruments, but the simple ETFs that can be bought and sold in any account including IRA and 401-K.
So what are my candidates for this study. First the standard leveraged ETFs (as they relate to the S&P 500):
SSO - A long 2x ETF tracking the S&P 500
UPRO - A long 3x ETF tracking the S&P 500
And some alternatives:
TMV - A 3x short Treasuries (20+ years) ETF
UUPT - A 3x long Dollar ETF
UDNT - A 3x short Dollar ETF
XIV - A short VIX ETF
Since the long Treasuries ETF did well during corrections, I want to look at the short Treasuries ETF during the rallies. The dollar ETFs were inconsistent as short instruments, but I will include them in this study as well in order to be thorough. And finally, I'll look at XIV, a short VIX ETF since VXX did so well as a hedge.
Let's look at our first rally of the year - February 4 to March 10. The first chart looks at absolute performance.


Colors are - Red (S&P 500), Blue (SSO, Green (UPRO), Pink (TMV), Turquoise (UUPT), Black (UDNT) and Gray (XIV).
The first conclusion is that once again, the leveraged ETFs perform as they are supposed to. The market is up about 7% and the 2x and 3x ETF are up 15% and 23% respectively which matches (or beats) their leverage ratio. Being long the dollar during this rally was not a good investment. But being short was not profitable either. I am afraid that this confirms the fact that the correlation between the markets and the dollar is not very strong. We'll see what happens in the next periods.
Surprisingly, being short Treasuries was not a big winner either. It didn't lose any money, but trailed the market toward the end of the period. Also something to be examined further. The big surprise again is the VIX ETF. Over the length of the period, it matches the return of the 2x ETF. But in the very short term, it's beats every other instrument. It benefits from the the fact that the VIX generally spikes during corrections, but comes down very quickly. Since XIV is inversely proportional to the VIX, it does produce these quick spikes up as well.
The next rally we are looking at is the period between April 14 and July 2. Again, the first chart shows the absolute performance while the second one shows the performances relative to the market. The colors are the same as the previous set.


As with the previous set, the dollar ETFs are inconsistent. Not gaining much and not losing much. These instruments still don't show much usable correlation with the market. Not much to say about the leveraged ETFs. The market is up about 8% in the period and the 2x ETF returns an expected 16% (a bit more) while the 3x ETF returns over 25%, slightly over the leverage ratio. This shows that during shorter periods, these ETFs do not suffer from the decay that they show during multi-year periods.
Surprisingly, the short Treasuries ETF is the worst performer. So again, not a very good choice if you are looking to outperform the market. But the biggest surprise is the VIX ETF. XIV is up over 50% in that 2.5 months period. It beats the 3x ETF by a large margin. Prolonged rallies without large corrections do erode the VIX considerably and XIV is a big beneficiary. Could the VIX ETF be a winner on the up side as well?
The next rally was shorter - about 3 weeks from August 7 to August 27. Based on what we saw in the first set, it should benefit the VIX ETF as the VIX crush is quick and violent.


Again, the charts show absolute and relative performances with the same color scheme.
And XIV doesn't disappoint, beating the market by 18% in 3 weeks and even the 3x ETF by 8%. It sounds repetitive, but the leveraged ETFs still perform as expected while the dollar ETFs show inconsistency again. The biggest disappointment so far is the short Treasury ETF which doesn't correlate as well with the market in rallies as the long ETF did during corrections.
The next period is a little longer and show the biggest gains in the market which should benefit the leveraged ETFs. Same chart parameters as before.


As expected, good performances from the leveraged ETFs. The long dollar ETF matches the market almost exactly but more a factor of external geopolitical influence than correlation. Being short the dollar was obviously a bad choice! Especially in a leveraged instrument. The short Treasuries ETF did not lose money and tracked the market nicely in the first 2 weeks but quickly lost steam probably also influenced by external factors.
And the winner is once again XIV, although not by as much as the last 2 sets but still significantly.
The last set we will look at are the last 2 weeks of 2014 where we had a nice little Santa Claus rally. Charting parameters are still the same.


The leveraged ETFs still perform as expected. And the long and short dollar ETFs return the exact same results as the last rally - the long ETF matching the market, while the short one losing a lot of ground. The Treasury ETF is very inconsistent, up big at some point but ending up about even.
This time, XIV doesn't keep pace with the 3x ETF but still does better than than the 2x ETF. A bit surprising as shorter time periods would tend to benefit the VIX ETF.
Conclusions
As in the previous post, the dollar ETFs proved to be too inconsistent to be of any value hedging or leveraging the market. In a future post I will study how they correlate to the spot dollar and how an investor could profit from the leverage factors that these ETFs offer.
The biggest disappointment was the short Treasuries ETF. The long ETF did show some promise in 2014 but it's also possible that it benefited from external events that boosted investments in US Treasuries. In a future post, I will also look at how these leveraged ETFs correlate to the underlying instruments.
The leveraged ETFs perform exactly or better than their leverage factor would indicate even on longer periods as decay doesn't seem to have any impact. These instruments are the most predictable ways to leverage your assets during rallies. You know exactly what to expect.
The biggest winner in 2014 was XIV, the short VIX ETF. It did benefit from long rallies where the VIX lost significant percentages. Being long XIV during the rallies yielded a combined 142% during 2014. That's a pretty good return no matter how you look at it! Of course, that implies a perfect timing which is impossible. But careful investment would still have yielded a nice return.
It's difficult to draw definite conclusions yet as I have only studied these ETFs in one main environment - a relentless bull market. It would be interesting to see how these ETFs perform in the reverse conditions. Maybe the topic for another post!
In Part 3 to be posted next week I will look at timing methods that could have been used in conjunction with the 2 VIX ETFs (VXX and XIV) to produce the best possible return. It looks to me that allocating some of your assets to these 2 ETFs could be a smart choice.
In this post I want to look at instruments that should do well in the long periods where the market was up. The idea is once again to leverage your assets by investing in instruments that will beat the market by a large margin. I am not looking at derivative instruments like futures or options which can add leverage to already leveraged instruments, but the simple ETFs that can be bought and sold in any account including IRA and 401-K.
So what are my candidates for this study. First the standard leveraged ETFs (as they relate to the S&P 500):
SSO - A long 2x ETF tracking the S&P 500
UPRO - A long 3x ETF tracking the S&P 500
And some alternatives:
TMV - A 3x short Treasuries (20+ years) ETF
UUPT - A 3x long Dollar ETF
UDNT - A 3x short Dollar ETF
XIV - A short VIX ETF
Since the long Treasuries ETF did well during corrections, I want to look at the short Treasuries ETF during the rallies. The dollar ETFs were inconsistent as short instruments, but I will include them in this study as well in order to be thorough. And finally, I'll look at XIV, a short VIX ETF since VXX did so well as a hedge.
Let's look at our first rally of the year - February 4 to March 10. The first chart looks at absolute performance.
This second chart looks at performances relative to the market.
Colors are - Red (S&P 500), Blue (SSO, Green (UPRO), Pink (TMV), Turquoise (UUPT), Black (UDNT) and Gray (XIV).
The first conclusion is that once again, the leveraged ETFs perform as they are supposed to. The market is up about 7% and the 2x and 3x ETF are up 15% and 23% respectively which matches (or beats) their leverage ratio. Being long the dollar during this rally was not a good investment. But being short was not profitable either. I am afraid that this confirms the fact that the correlation between the markets and the dollar is not very strong. We'll see what happens in the next periods.
Surprisingly, being short Treasuries was not a big winner either. It didn't lose any money, but trailed the market toward the end of the period. Also something to be examined further. The big surprise again is the VIX ETF. Over the length of the period, it matches the return of the 2x ETF. But in the very short term, it's beats every other instrument. It benefits from the the fact that the VIX generally spikes during corrections, but comes down very quickly. Since XIV is inversely proportional to the VIX, it does produce these quick spikes up as well.
The next rally we are looking at is the period between April 14 and July 2. Again, the first chart shows the absolute performance while the second one shows the performances relative to the market. The colors are the same as the previous set.
As with the previous set, the dollar ETFs are inconsistent. Not gaining much and not losing much. These instruments still don't show much usable correlation with the market. Not much to say about the leveraged ETFs. The market is up about 8% in the period and the 2x ETF returns an expected 16% (a bit more) while the 3x ETF returns over 25%, slightly over the leverage ratio. This shows that during shorter periods, these ETFs do not suffer from the decay that they show during multi-year periods.
Surprisingly, the short Treasuries ETF is the worst performer. So again, not a very good choice if you are looking to outperform the market. But the biggest surprise is the VIX ETF. XIV is up over 50% in that 2.5 months period. It beats the 3x ETF by a large margin. Prolonged rallies without large corrections do erode the VIX considerably and XIV is a big beneficiary. Could the VIX ETF be a winner on the up side as well?
The next rally was shorter - about 3 weeks from August 7 to August 27. Based on what we saw in the first set, it should benefit the VIX ETF as the VIX crush is quick and violent.
Again, the charts show absolute and relative performances with the same color scheme.
And XIV doesn't disappoint, beating the market by 18% in 3 weeks and even the 3x ETF by 8%. It sounds repetitive, but the leveraged ETFs still perform as expected while the dollar ETFs show inconsistency again. The biggest disappointment so far is the short Treasury ETF which doesn't correlate as well with the market in rallies as the long ETF did during corrections.
The next period is a little longer and show the biggest gains in the market which should benefit the leveraged ETFs. Same chart parameters as before.
As expected, good performances from the leveraged ETFs. The long dollar ETF matches the market almost exactly but more a factor of external geopolitical influence than correlation. Being short the dollar was obviously a bad choice! Especially in a leveraged instrument. The short Treasuries ETF did not lose money and tracked the market nicely in the first 2 weeks but quickly lost steam probably also influenced by external factors.
And the winner is once again XIV, although not by as much as the last 2 sets but still significantly.
The last set we will look at are the last 2 weeks of 2014 where we had a nice little Santa Claus rally. Charting parameters are still the same.
The leveraged ETFs still perform as expected. And the long and short dollar ETFs return the exact same results as the last rally - the long ETF matching the market, while the short one losing a lot of ground. The Treasury ETF is very inconsistent, up big at some point but ending up about even.
This time, XIV doesn't keep pace with the 3x ETF but still does better than than the 2x ETF. A bit surprising as shorter time periods would tend to benefit the VIX ETF.
Conclusions
As in the previous post, the dollar ETFs proved to be too inconsistent to be of any value hedging or leveraging the market. In a future post I will study how they correlate to the spot dollar and how an investor could profit from the leverage factors that these ETFs offer.
The biggest disappointment was the short Treasuries ETF. The long ETF did show some promise in 2014 but it's also possible that it benefited from external events that boosted investments in US Treasuries. In a future post, I will also look at how these leveraged ETFs correlate to the underlying instruments.
The leveraged ETFs perform exactly or better than their leverage factor would indicate even on longer periods as decay doesn't seem to have any impact. These instruments are the most predictable ways to leverage your assets during rallies. You know exactly what to expect.
The biggest winner in 2014 was XIV, the short VIX ETF. It did benefit from long rallies where the VIX lost significant percentages. Being long XIV during the rallies yielded a combined 142% during 2014. That's a pretty good return no matter how you look at it! Of course, that implies a perfect timing which is impossible. But careful investment would still have yielded a nice return.
It's difficult to draw definite conclusions yet as I have only studied these ETFs in one main environment - a relentless bull market. It would be interesting to see how these ETFs perform in the reverse conditions. Maybe the topic for another post!
In Part 3 to be posted next week I will look at timing methods that could have been used in conjunction with the 2 VIX ETFs (VXX and XIV) to produce the best possible return. It looks to me that allocating some of your assets to these 2 ETFs could be a smart choice.
Sunday, January 4, 2015
S&P 500 Leverage and Hedges Options - Part 1
Following my post on the ETFs tracking the VIX and looking at some of the performances achieved over the last 4 years or so, I decided to compare traditional leveraging and hedging options for the S&P 500 with some alternatives. In Part 1, I will look at ETFs for protection against a correction. Part 2 will look at leveraging for going long.
Usually, investors looking for leveraging or hedging use the following instruments:
For these 2 posts, I will only consider leveraged ETFs since they can be traded in a regular or retirement account. There are many leveraged ETFs for the S&P 500 on the market but I will look at the most actively traded. They are:
SSO - A long 2x ETF tracking the S&P 500
UPRO - A long 3x ETF tracking the S&P 500
SDS - A short 2x ETF tracking the S&P 500
SPXU - A short 3x ETF tracking the S&P 500
Since I also want to look at alternative options (looking for possible correlations) that might be overlooked, I will add the following ETFs to the comparisons:


We need to look at more corrections to draw some definite conclusions so let's look at the next one between July 23 and August 7.


Symbols are in the same order as the previous chart.
Let's look at 2 more 2014 corrections to see if the trend holds. We had another longer and deeper correction in September:

And with the S&P 500 as baseline:

Symbols are in the same order as the previous chart.

And with the S&P 500 as baseline:

It is difficult to draw conclusions over only 4 sets. Especially given the fact that these periods were very short since the market has been up almost the entire year. The dollar ETFs are not reliable enough to make good edges. They will not lose you any money mostly, but they won't make you much either. The leveraged ETFs perform as expected offering good protections against short-term corrections. We would need to look at longer down periods to see what kind of damage decay does to these ETFs. The long Treasuries ETF does outperform the leveraged ETF in 2 out of 4 sets and does offer some level of protection. There are some outside factors at play such as the geopolitical situation which does influence the flow of money. Still, seemingly a safe alternative to the usual hedge options. But it seems that we have a winner with VXX. In these short corrections, it outperforms even the 3x ETF by a wide margin. The problem with VXX is the long term decay though. The VIX goes through quick spikes and long periods of calm which are deadly to VXX. If you look at the long term chart above, you can see that VXX is the worst performer over the last 3 years. But as a short term hedge, it clearly has a lot of potential! Now it's all in the timing.
I will check some corrections from previous years and update this post with that data to see if these conclusions hold over time.
Part 2 will look at the longer periods of 2014 when the market was up. I will post that sometimes this week.
Usually, investors looking for leveraging or hedging use the following instruments:
- Leveraged ETFs
- Options
- Futures
- On long dated options, the spread between the bid and ask can be wide especially with more illiquid leveraged ETFs. That can rob the investor of a good portion of the investment.
- Some IRA and 401K accounts will not let you trade options.
For these 2 posts, I will only consider leveraged ETFs since they can be traded in a regular or retirement account. There are many leveraged ETFs for the S&P 500 on the market but I will look at the most actively traded. They are:
SSO - A long 2x ETF tracking the S&P 500
UPRO - A long 3x ETF tracking the S&P 500
SDS - A short 2x ETF tracking the S&P 500
SPXU - A short 3x ETF tracking the S&P 500
Since I also want to look at alternative options (looking for possible correlations) that might be overlooked, I will add the following ETFs to the comparisons:
TMF - A 3x long Treasuries (20+ years) ETF
TMV - A 3x short Treasuries (20+ years) ETF
UUPT - A 3x long Dollar ETF
UDNT - A 3x short Dollar ETF
XIV - A short VIX ETF
VXX - A long VIX ETF
These might look out of place but there is a correlation between all these instruments and it makes for an interesting study. First, let's look at the standard ETFs in comparison to the underlying instrument over the last 3 years:
I am choosing the last 3 years for this study not because it a long term bull market, but some of these ETFs are recent and I cannot make longer term comparisons. For reference, the ETFs are in the same order at the top of the graphic as they are in my list. Nor surprisingly, the long leveraged ETFs do very well over that period given the fact that the S&P500 is up over 55%. The short ETFs are just crushed in the same period. We'll see how they do during periods of weakness over the last 3 years for reference.
What is more interesting is the performance of some of the ETFs. If we use the S&P as baseline for performance, we get the following chart:
The 2x ETF behaves as expected, doubling the underlying instrument. But the 3x ETF gets much better results than we would anticipate, up over 250% in the same period. And there is not much difference between the 2x and 3x short ETFs. The losses are somewhat consistent with the leverage factor but aggravated by decay. More so with the 2x ETF. This could be the results of the asset mix as well.
Clearly, in a long bull market like the one we have been experiencing, that 3x ETF makes a very good investment.
Let's look at the result of the alternative instruments for a comparison.
For reference, the chart also follow the list above. Clearly, VIX ETFs look like they have potential for leverage and hedging. The long VIX ETF gets obliterated in this long bull market as the VIX hit some long time lows. As I have posted many times on PSW before, VXX also suffers from decay due to the underlying VIX futures. But look at XIV, the short VIX ETF. At one point, it was up over 550%! We'll need to compare with the 3x S&P 500 ETF for a clearer picture, but it looks like we might have a good candidate there. The leveraged treasuries and dollar ETF don't seem to have the volatility for long term plays. And the correlation doesn't seem clear. We'll look at shorter periods to get more information. Using the S&P as baseline, we get the following chart:
Dollar and treasuries ETF do overperform the market at times so there might be sceanrio where they are an option. But this chart really outlines the potential for XIV.
Hedging for Corrections
Let's look at the short periods when the market took breathers last year. There were very few big ones though. Earlier in 2014, we had a short 5% correction. What hedge would have paid off best then:
And with the S&P 500 as baseline:
The symbols are SDS, SPXU, TMF, UUPT,UDNT and VXX. Here are some observations:
- Both dollar ETFs outperform the market with the short ETF actually ending slightly better. The correlation is not clear in that set.
- The short Treasuries ETF does pretty well, up 15% and outperforming the index by over 20%.
- The short leveraged ETF do their jobs, pretty much doubling and tripling the index loss as expected with the leverage factor.
- But the big winner in that short period is the long VIX ETF VXX. It's up about 29% and outperforms the index by a whopping 35% in 3 weeks. It does take a while to get started, but as the index goes further down, the gains accelerate.
And with the S&P 500 as baseline:
- Long treasuries and long dollar ETFs do outperform the market again by 6 and 7% respectively. Not the best of hedges, but safe places to park your money!
- The leveraged ETFs perform as expected, returning performances in line with their leverage factors.
- But the winner is once again VXX and by a 10% margin like during the earlier period.
Let's look at 2 more 2014 corrections to see if the trend holds. We had another longer and deeper correction in September:
And with the S&P 500 as baseline:
Symbols are in the same order as the previous chart.
- No big surprise with the leveraged ETF again. Their performance in short periods of time seems to be reliable.
- Being long the dollar does seem to provide some protection although it does not have very high returns.
- The long Treasury ETF is a big winner in that period as money flowed from the market to treasuries. It even outperformed the leveraged ETFs in that month.
- And once again, VXX is a huge winner, outperforming the second best ETF by over 20% and beating the market by 55% in one month!
And with the S&P 500 as baseline:
- Being short the dollar worked better than being long as opposed to the other times.
- The short Treasuries ETF outperforms the leveraged ETFs again although not by much.
- Leveraged ETF are consistent with the previous periods.
- But look again at VXX! Getting double the performance of the second best ETF.
It is difficult to draw conclusions over only 4 sets. Especially given the fact that these periods were very short since the market has been up almost the entire year. The dollar ETFs are not reliable enough to make good edges. They will not lose you any money mostly, but they won't make you much either. The leveraged ETFs perform as expected offering good protections against short-term corrections. We would need to look at longer down periods to see what kind of damage decay does to these ETFs. The long Treasuries ETF does outperform the leveraged ETF in 2 out of 4 sets and does offer some level of protection. There are some outside factors at play such as the geopolitical situation which does influence the flow of money. Still, seemingly a safe alternative to the usual hedge options. But it seems that we have a winner with VXX. In these short corrections, it outperforms even the 3x ETF by a wide margin. The problem with VXX is the long term decay though. The VIX goes through quick spikes and long periods of calm which are deadly to VXX. If you look at the long term chart above, you can see that VXX is the worst performer over the last 3 years. But as a short term hedge, it clearly has a lot of potential! Now it's all in the timing.
I will check some corrections from previous years and update this post with that data to see if these conclusions hold over time.
Part 2 will look at the longer periods of 2014 when the market was up. I will post that sometimes this week.
Tuesday, December 16, 2014
VIX and Proxy ETFs
Following my post on gold and proxies, I wanted to investigate another instrument where proxy ETF get some interesting results - the VIX. To begin with, here is a quick interpretation of the VIX from Wkipedia:
http://en.wikipedia.org/wiki/VIX
Speaking of trading, you cannot trade the VIX directly but you have to use futures if your broker offers it or options. Trading options on the VIX is notoriously risky as they do not track the VIX itself (which is not traded) but futures. Here is a good article on VIX options:
http://sixfigureinvesting.com/2010/01/trading-vix-options/
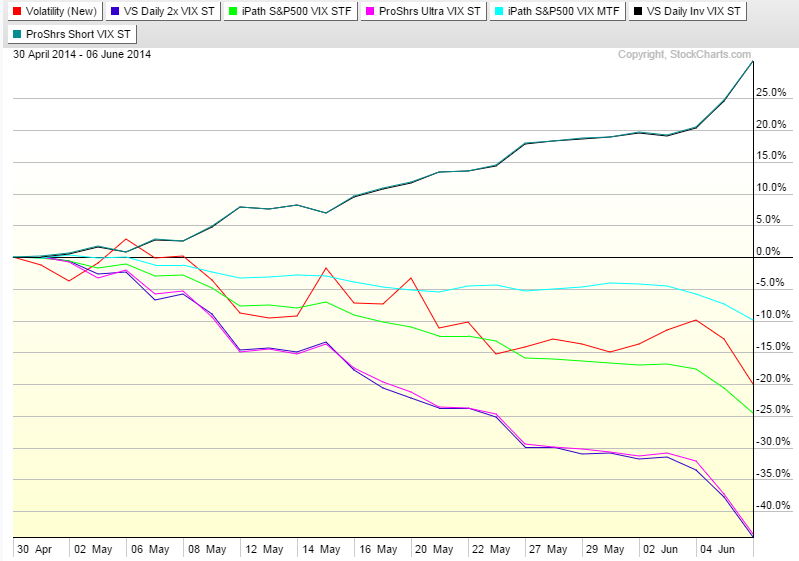
The alternative to trading futures and options are ETFs and many of them have been constructed around VIX futures. Here are the ones that I am investigating in this post:
Long:
TVIX - VelocityShares Daily 2x VIX ST ETN (leveraged)
VXX - iPath S&P 500 VIX ST Futures ETN
UVXY - ProShares Ultra VIX Short-Term Futures (leveraged)
VXZ - iPath S&P 500 VIX MT Futures ETN


http://en.wikipedia.org/wiki/VIX
The VIX is quoted in percentage points and translates, roughly, to the expected movement (with the assumption of a 68% likelihood i.e. one standard deviation) in the S&P 500 index over the next 30-day period, which is then annualized. For example, if the VIX is 15, this represents an expected annualized change, with a 68% probability, of less than 15% over the next 30 days; thus one can infer that the index option markets expect the S&P 500 to move up or down 15%/√12 = 4.33% over the next 30-day period.[6] That is, index options are priced with the assumption of a 68% likelihood (one standard deviation) that the magnitude of the change in the S&P 500 in 30-days will be less than 4.33% (up or down).The VIX is very important as it does give us a window on the traders' sentiment. It's not perfect as with many indicators, it lags since it derives from a reaction to current conditions and therefore does not necessarily reflect what will happen in the future. It is a matter of fact, the VIX which is supposed to measure volatility suffers itself from excessive volatility making it difficult to trade.
The price of call and put options can be used to calculate implied volatility, because volatility is one of the factors used to calculate the value of these options. Higher (or lower) volatility of the underlying security makes an option more (or less) valuable, because there is a greater (or smaller) probability that the option will expire in the money (i.e., with a market value above zero). Thus, a higher option price implies greater volatility, other things being equal.
Speaking of trading, you cannot trade the VIX directly but you have to use futures if your broker offers it or options. Trading options on the VIX is notoriously risky as they do not track the VIX itself (which is not traded) but futures. Here is a good article on VIX options:
http://sixfigureinvesting.com/2010/01/trading-vix-options/
The alternative to trading futures and options are ETFs and many of them have been constructed around VIX futures. Here are the ones that I am investigating in this post:
Long:
TVIX - VelocityShares Daily 2x VIX ST ETN (leveraged)
VXX - iPath S&P 500 VIX ST Futures ETN
UVXY - ProShares Ultra VIX Short-Term Futures (leveraged)
VXZ - iPath S&P 500 VIX MT Futures ETN
Short:
XIV - VelocityShares Daily Inverse VIX ST ETN
SVXY - ProShares Short VIX Short-Term Futures
My first look at long term performance was most revealing and what led me to write this post. I had some inkling about at least one ETF, VXX as I write extensively about it on Phil's Stock World. However, I was not aware of the extent of the problem for some of these ETFs.
Looking at the earliest date where all these ETF existed, here are the performances:
Clearly, the VIX has lost 50% since that date so it is expected that long VIX ETFs will suffer. But they just don't suffer, they get obliterated. Looking closely at the results, some of these ETFs are now worth around 1% of their original value and it's a matter of fact, some of them have been reset a couple of times already. On the other hand, short VIX ETFs have done tremendously well, up about 450% in about 3 years. And some good stops strategy would have yielded much better gains.
To be faire, let's look at a period where the VIX ended up higher than at the beginning of the chart:
So now we see a period where the VIX is 60% higher at the end of the period than it was when we start tracking performance and yet long VIX ETFs are once again killed with the leveraged ETFs suffering catastrophic losses. Short VIX ETFs still show a profit despite the fact that the VIX is actually higher.
Looking at the underlying instrument, it's easy to understand the problem. The VIX shows some quick spikes up followed by long quiet periods where it loses value. As opposed to stocks (well most of them at least), there is no possible long term appreciation of the VIX. It is basically an indicator. It cannot be used as a long term investment instrument. It is meant to be traded over short term periods. The problem with all these ETFs is that like some that we looked at for oil, they are constructed around futures which need to be rolled over from month to month and suffer from decay if the underlying instrument does not go in the direction of the ETF. And since the VIX itself cannot be relied to go up over long time periods, these long ETF have no chance in the long run.
Let's look at shorter term scenarios to see where some of these ETFs could be used as trading substitutes. Let's first pick a short term period where the VIX goes lower and look at the performances:
Over this time period (about 5 weeks), the VIX loses 20% of its value. The short ETFs do their job and gain close to 30% over that time period. I suspect that they have very similar holdings as they move so close to each other in the short term. I could not pick one over the other.
Clearly, the leveraged VIX ETF lose much more, over 40%. Somewhat expected when you are leveraged 2x. VXX loses more than the VIX itself, but once again, it's only decay doing its work there. VXZ seems to be holding up better and it did in fact get the best performance of these long ETFs in the long term. Not sure why and I don't have the exact holdings to make comparisons.
Now lets look at a period where the VIX gains value:
This chart does explain quickly the long term results. Even though the VIX is up 37% over that 5 weeks period, the short ETFs are only down 20%. But look at the long ETFs! What is going on with the leveraged ETFs - they barely keep up with the VIX and end up 5 to 10% lower. Looking at the results over a down period, you would expect them to over perform when the VIX goes higher. But that is not the case. Looking at the standard ETFs, they lag the underlying instrument by 20 to 30%. Not what you would expect either. Very disappointing.
So, if these long ETFs cannot keep up when the VIX ramps up but lose more value when the VIX goes down, what is the point in even owning them for the long run. Even in the shorter run, they don't seem to perform as expected. Short ETFs clearly outperform on both sides on the equation. They seem to match the VIX on the down side and are more resilient when conditions are not ideal. This does explain the long term results given the fact that the VIX goes down for longer periods.
Conclusion
This post looks at periods covering weeks at a time, not hours. In addition, I have looked at only a couple of periods. This is not an exhaustive study. Maybe a topic for another post. In the case of the leverage long ETFs, my feelings are that they are better treated as trading instruments for periods of hours to days. They clearly underperform the underlying instrument by a wide margin in the long term. The only drawback is that these instruments are not ideally suited to be used as hedges for a larger portfolio where the holding period has to be measured in weeks. There has to be better alternatives.
The short VIX ETFs make an interesting case of longer term investment. It's difficult to say if the last 3 years are indicative of what we will see in the next 3 years. But even at higher levels, the VIX still follows a nice pattern of quick burst higher and quieter periods thereafter which benefits these short ETFs. In any case, they also seem to make more reliable trading instruments as they mimic the moves of the underlying instrument better.
Sunday, December 14, 2014
Oil Trade Proxies
We had an interesting discussion on Phil's Stock World last week regarding trades around the oil sell off and a possible rebound. Some of the members where looking at different instruments (leveraged and non-leveraged) and that perked my interest enough that I wanted to do some back testing around these instruments.
In order to do some testing, I needed to first look at some signals that could be used for trades. In order to keep it simple, I settled on MACD in a weekly view. This might not be the ideal indicator (it's lagging), but it's gives good enough signals for the purpose of our testing. Here is the chart that I generated:


Results for Period 1 - Short


Results for Periods 5 - Short

The current period shows a large down move by oil, down over 42% in 5 months. Clearly not a standard correction! This time, OIH follows the price of oil almost step for step. USO is again a decent proxy although showing more resilience at time. XLE is clearly supported by a strong equity market.
The results with the leveraged ETF is shocking:

Sure, decay might take a bite out of the performance eventually but who cares with a current return of 160%! DUG is also showing a nice return following the disappointing OIH.
Conclusion
As pointed out above, I don't see oil as a long term investment, more like a trading instrument. But rather than dealing with futures which require a full time trading job, I wanted to explore some possible proxies that would allow for more simple and still profitable trades. USO is generally seen as the best proxy for oil and it does prove to be that way for medium term trades. If you are bullish oil on the long term though, USO is not the instrument you want as it does decay with the underlying futures. For long term investment, you are probably better off with XLE although OIH could see more appreciation in the medium term since many of its components are currently very cheap. But not without risks as some could face difficult times financially if oil doesn't recover quickly.
For medium term trades, you probably should look at the leveraged oil ETF like UCO and SCO. They clearly show some great results over multiple months but do suffer from decay as well. As it is, they should not be seen as long term trading instruments. DIG and DUG show potentially good returns, but as proxies for XLE and OIH rather than the oil price itself.
In order to do some testing, I needed to first look at some signals that could be used for trades. In order to keep it simple, I settled on MACD in a weekly view. This might not be the ideal indicator (it's lagging), but it's gives good enough signals for the purpose of our testing. Here is the chart that I generated:
The vertical lines indicate the weeks where we reverse our position from long and to short and vice-versa. There are some pretty good signals there and once again as usual in trading, it comes down to position size and managing your stops. The instruments that I wanted to backtest are ETFs. Some are leveraged 2x or 3x, others are non-leveraged. There are ETF build around oil futures like USO and the leveraged UCO and SCO while others hold energy company stocks like XLE and OIH. There are also leveraged versions (long and short) of Oil and Gas industry - DIG and DUG. While not exact replicates of OIH, they perform in similar ways sometimes as we will see.
Looking at long terms results using non-leverage ETF, we get the following performance chart:
The first fact that appears on this chart is that USO makes a very bad proxy for a long term oil position. Even though oil is now down as compared to its 2006 levels, USO is down 50% more. It's most likely the result of decay from having to roll futures from month to month. So, even if you have a long term bullish view on oil, it is tough to justify using USO as a proxy. It's clear that on a long term basis, XLE (green) makes the better proxy. The only issue is that like most US equities, it seem to have overextended itself since mid-2013 when it somewhat disconnected with oil prices. The oil services ETF (OIH - pink) seems to have a close correlation, but suffered in 2011 and 2012 and didn't recover. However, it has not been as bad as USO and might possibly have the most ground to make up on recovery.
Overall though, as with many commodities, oil is better traded than invested in. The choices are to trade futures on short term charts (down to minutes) or longer term with proxies on weekly chart like the one above.
For this study, I want to concentrate on the following periods because they show some interesting results:
Period 1: May 9. 2011 to October 24, 2011 - Short
Period 2: October 24, 2011 to April 2, 2012 - Long
Period 3: September 30, 2013 to February 10, 2014 - Short
Period 4: February 10, 2014 to July 21, 2014 - Long
Period 5: July 21, 2014 to Today - Short
Results for Period 1 - Short
During that period, oil was down as much as 32% and finished the period down about 18%. Interestingly enough, the non-future based ETF XLE and OIH lagged the downside move but abruptly caught up in August 2011. But this also a month where the overall market suffer a large loss so looking at oil only doesn't convey the complete picture. In essence, XLE and OIH are proxies for equity market with a strong influence from oil it seems. On the other hand, for that short term period, USO makes a pretty faithful proxy, down only a couple more percent that oil itself.
The following chart adds the leveraged short ETF:
Clearly, SCO is a winner in the long run, up about 27% at the end of the period while oil is down 20%. Managing your position with some stops could have yielded some very interesting gains, but even 27% is a nice returns for 6 months. But it does seem that decay takes a bite out of the returns in the long run as the 2x ETF doesn't return that percentage in the end. But overall, some nice gains. DUG pretty much follows OIH but the mix is not perfect as the final return of 10% doesn't reflect the losses in OIH.
Results for Period 2 - Long
During this period, oil is up about 12% and again, USO is a faithful proxy, only down over 1% as compared to oil for the same period. XLE and OIH on the other hand recovered slower, following the equity markets. It was actually the beginning of a downtrend for OIH as outlined above.
Adding the leveraged ETF, we get the following results:
Double-leverage with UCO this time is again the winner and could have yielded some good returns with good position management. But there again, the decay associated with leveraged ETF is starting to make a difference at the end, with the 2x ETF yielding only about 1.5x the underlying instrument. But 16% return over 5 months is not bad! $10,000 invested in the 2x leveraged ETF at the beginning of Period 1 would have returned $14,732.00 at the end of Period 2 (less than one year). And that is without additional leverage like options! DIG doesn't make a very good proxy at all because it is plagued by the poor performance of the oil industry in general.
Results for Period 3 - Short
Once again, we see a disconnect between the industry based ETF like XLE and OIH and the price of oil. USO proves again to be a good proxy for short term periods. As seen in the long term chart at the beginning of the article, OIH is overall more sensitive to the oil prices than XLE. It's partially the case because XLE is made up of integrated oil giants like XOM or CVX who can partially benefit from lower oil prices with their chemical divisions.
Adding the short leverage ETF, we get the following results:
Not surprisingly given the fact that XLE and OIH stayed somewhat above water, DUG performed opposite what it was expected. SCO is a winner again and again, we can see the results of decay toward the end of the period.
Results for Period 4 - Long
Some very interesting results in this period. The signal tells us to go long but in fact, oil prices stay flat. For some reason, USO actually outperform the underlying commodity but we would need to look to see if oil prices were in contango or backwardation to have a better idea since USO is based on futures with various expirations. XLE and OIH take off about 20% in that time period, but probably influenced by the equity markets rather than oil prices.
The results with the leveraged ETF is as follows:
As expected given the performance of OIH and XLE, DIG takes off like a rocket and returns over 30% in 5 months. But even UCO shows a profit of close to 8% despite oil being flat.
Results for Periods 5 - Short
The current period shows a large down move by oil, down over 42% in 5 months. Clearly not a standard correction! This time, OIH follows the price of oil almost step for step. USO is again a decent proxy although showing more resilience at time. XLE is clearly supported by a strong equity market.
The results with the leveraged ETF is shocking:
Conclusion
As pointed out above, I don't see oil as a long term investment, more like a trading instrument. But rather than dealing with futures which require a full time trading job, I wanted to explore some possible proxies that would allow for more simple and still profitable trades. USO is generally seen as the best proxy for oil and it does prove to be that way for medium term trades. If you are bullish oil on the long term though, USO is not the instrument you want as it does decay with the underlying futures. For long term investment, you are probably better off with XLE although OIH could see more appreciation in the medium term since many of its components are currently very cheap. But not without risks as some could face difficult times financially if oil doesn't recover quickly.
For medium term trades, you probably should look at the leveraged oil ETF like UCO and SCO. They clearly show some great results over multiple months but do suffer from decay as well. As it is, they should not be seen as long term trading instruments. DIG and DUG show potentially good returns, but as proxies for XLE and OIH rather than the oil price itself.
Wednesday, November 16, 2011

Tuesday, October 4, 2011
Timing the Market - Part 2
Yesterday I published a post on timing the market that was based on a monthly bar crossing below a 10 period moving average. To be totally accurate, the author mentioned that she uses a 10 period average for the crossover, but also says that other periods such as 6, 8 or more than 10 might work depending on the market. It also seems that even numbers work better than odd numbers of periods! Something to backtest another time I guess.
This time I will expand on methods outlined by Charles D. Kirkpatrick II in his book (Invest by Knowing What Stock to Buy and What Stock to Sell) and also his web site as well as outline a new method based on his findings. I spoke about this author and this book in a previous post where I mentioned his fundamental analysis method. I will not go over his stock picking process, but what I found interesting was his market timing methods - he outlines 2 of them - one simple one and the other more complex. Given his success I thought that something could be learned from him. For reference, here is an equity curve of his current portfolio:

The lime green line is the results of his picks and they don't do too badly against the broader market. But the purple line is the result of his timing rules being applied to the stock picking screen. As you can tell by the flat line, for a big portion of 2008 and 2009, he was out of the market. He did miss the mid-year rally in 2008, but was out during the crash and suffered little drawdown compared to the market. Obviously the method is not perfect as 2010 was not great, but it could also be the results of bad picks!


This time I will expand on methods outlined by Charles D. Kirkpatrick II in his book (Invest by Knowing What Stock to Buy and What Stock to Sell) and also his web site as well as outline a new method based on his findings. I spoke about this author and this book in a previous post where I mentioned his fundamental analysis method. I will not go over his stock picking process, but what I found interesting was his market timing methods - he outlines 2 of them - one simple one and the other more complex. Given his success I thought that something could be learned from him. For reference, here is an equity curve of his current portfolio:
The lime green line is the results of his picks and they don't do too badly against the broader market. But the purple line is the result of his timing rules being applied to the stock picking screen. As you can tell by the flat line, for a big portion of 2008 and 2009, he was out of the market. He did miss the mid-year rally in 2008, but was out during the crash and suffered little drawdown compared to the market. Obviously the method is not perfect as 2010 was not great, but it could also be the results of bad picks!
But back to his market timing methods:
1. As explained in a PDF linked on his web site (Portfolio Construction using Kirkpatrick Methods), sometimes the simplest is the best. He uses 2 weekly moving averages and watches for crossovers. When the 2-week SMA of the S&P500 crosses below the 14-week SMA of the same index, he goes to cash. When the 2-week average crosses above the 14-week average, he goes back in using his stock screener. For example, lets looks at these averages over the last 2 years:

Weekly chart of SPY - Click to enlarge
The red circle point out where he would have gone to cash while the green ones point to weeks where he went back to the market. Keep in mind that these are weekly candles so while there is some whipsaw, this method does keep you in the market during good rallies and keep you out during corrections! For example, this method would have kept you out of the August and September corrections this year. Once again, you might miss tops and bottoms but it does beat buying high and selling low!
2. The method that he explains in his book is a little more complicated and deals with scaling in and out. His portfolios are based on models - mostly picking stocks with low price-to-sales ratio and of high relative strength. He tracks the model value on a weekly basis and checks it against moving averages - 12-, 26- and 52-week averages. If the value of the model crosses below the 12-week average, he sells 25% of the portfolio. If the value declines below the 26-week average, he raises 25% more cash and liquidates everything once the value declines below the 52-week average. This protects him from complete wipeouts! He proceeds the opposite way to return to market - investing 25% once the value crosses over the 12-week average, another 25% when above the 26-week average and is fully invested once above the 52-week average.
Since not everybody will track a specific model, this might be harder to implement. But in effect, we all access to a pre-made model. It's called an index or in some cases, an ETF! I am not certain that Charles Kirkpatrick would approve of this, but based on the chart below it seems that it could provide the basis of a new method.

Weekly chart of SPY - Click to enlarge
In this case, the method would call for going to 25% cash when the index crosses one of the SMA lines, to 50% cash when it crosses 2 of the SMA and all in cash once below all 3 SMA. And reverse the process for going back to market, scaling back in each time the index crosses an SMA line 25%, then another 25% up to 100% in when all SMA lines have been crossed. This method would have kept you out of the worse corrections and got you back in quickly once the corrections were over, but in a cautious manner. There is some whipsaw at the tops and bottoms (and remember, this is a weekly chart going back 8 years), but in general, you are in during good rallies and out during corrections (or short)!
Now all you need is to pick winners!
Subscribe to:
Posts (Atom)