
Friday, May 13, 2011
Dollar Fibonacci Retracement - 5-13-2011
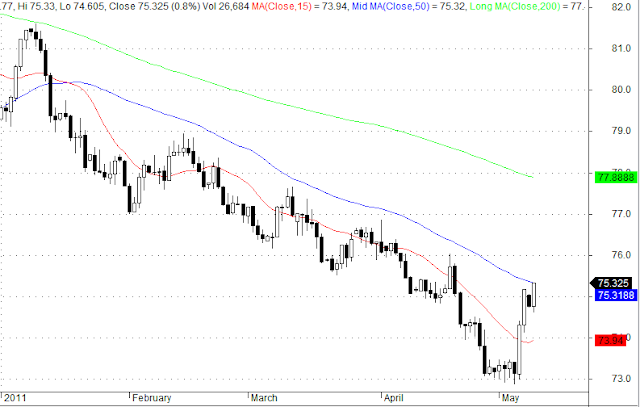
And to match the euro Fibonacci retracement, here is the opposite chart with the dollar using the lows of October and the highs of January as anchors. The red dotted line is a regression channel for 2011 and we are against the top line now!

Euro charts 5-13-2011
Some euro charts to put the latest moves in perspective.
First a regression channel for 2011. We are now at the bottom of the channel which should provide some support.

And now for some Fibonacci lines - using the 2001 low and highs as anchors. As with the regression channel, 1.41 seems to be a good support level. At least temporarily.

And finally, a Fibonacci regression using the previous highs of last October and the lows of January as anchors. Once again, the 1.41 line is significant.

Monday, May 9, 2011
Dollar reaches 50 dma!
The dollar is not at its 50 dma which has been breached last in January! Might be a good resistance point...

Subscribe to:
Comments (Atom)