TBT from the description on Yahoo: ProShares UltraShort 20+ Year Treasury (the Fund), formerly ProShares UltraShort Lehman 20+ Year Treasury, seeks daily investment results that correspond to twice (200%) the inverse (opposite) of the daily performance of the Barclays Capital 20+ Year U.S. Treasury Bond Index (the Index).
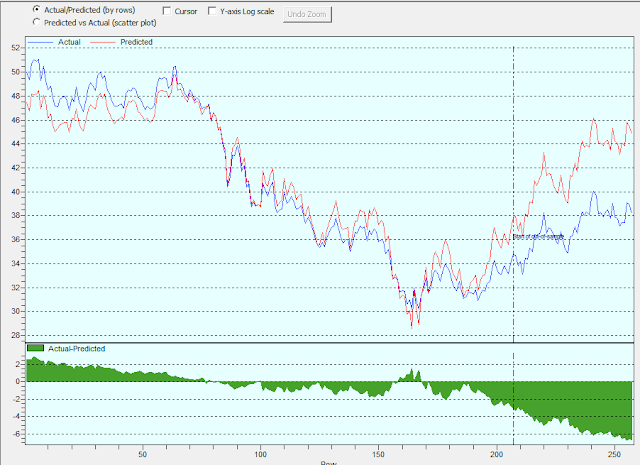
As a leveraged ETF, it suffers from decay in volatile market, but I wanted to see if I could find a model that would display the correlation between TBT and TLT (the index it is supposed to track). I cranked out ChaosHunter from Ward and used the daily close for 2010 and up to Friday. I used the first 200 days to create the model and the last 50 or so days for out of sample testing. Amazingly enough, the model tracked well in most of last year but shows now a much bigger divergence:
The out-of-sample period starts after the vertical dotted line. For the statistician, here are the numbers:
Either TBT is now a victim of decay or it is undervalued as compared to TLT. I will try post the results of a longer term model to see the effects of decay over multiple years.


No comments:
Post a Comment