
Friday, May 13, 2011
Dollar Fibonacci Retracement - 5-13-2011
And to match the euro Fibonacci retracement, here is the opposite chart with the dollar using the lows of October and the highs of January as anchors. The red dotted line is a regression channel for 2011 and we are against the top line now!

Euro charts 5-13-2011
Some euro charts to put the latest moves in perspective.
First a regression channel for 2011. We are now at the bottom of the channel which should provide some support.

And now for some Fibonacci lines - using the 2001 low and highs as anchors. As with the regression channel, 1.41 seems to be a good support level. At least temporarily.

And finally, a Fibonacci regression using the previous highs of last October and the lows of January as anchors. Once again, the 1.41 line is significant.

Monday, May 9, 2011
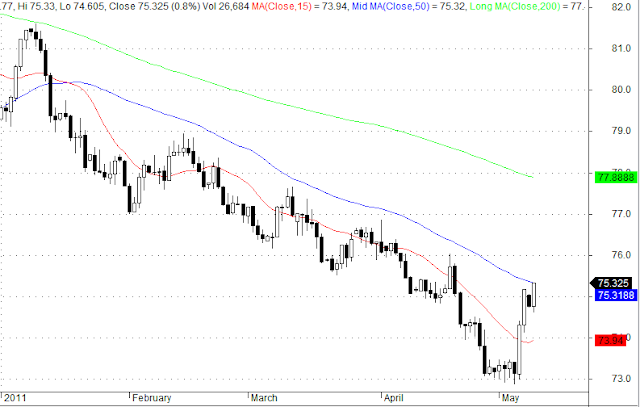
Dollar reaches 50 dma!
The dollar is not at its 50 dma which has been breached last in January! Might be a good resistance point...

Friday, April 29, 2011
Copper - Regression Channel 4/29/2011
Copper is getting close to the lower limit of the regression channel it has been in since last June!


Wednesday, April 6, 2011
Silver - Resistance Line?
Here is an updated chart with the Fibonacci retracement. This is the same chart I posted yesterday and as predicted, silver is hedging closer to $40. The $39.60 Fibonacci line is holding for the moment, but weakness in the dollar should propel silver over that bar eventually.

Tuesday, April 5, 2011
Silver - Regression and Retracement
And here is a quick chart for silver

Quite the parabolic move for silver. Same overlay as the gold chart - regression channel with a standard deviation of 1 and a Fibonacci retracement from the lows of August to December and January! Silver has had a much better run than gold in the that timespan. There was some hesitation around the 50% line, but it has been a runaway train since then. Looks like the $40.00 line could be a target.

Click for a larger image
Quite the parabolic move for silver. Same overlay as the gold chart - regression channel with a standard deviation of 1 and a Fibonacci retracement from the lows of August to December and January! Silver has had a much better run than gold in the that timespan. There was some hesitation around the 50% line, but it has been a runaway train since then. Looks like the $40.00 line could be a target.
Gold - Regression and Retracement
A quick chart of gold to try guessing were we are going.

The parallel lines are a regression channel using a standard deviation of 1. The Fibonacci retracement originates at the lows of last August and retraces from the highs of December to the lows of January. All the retracement lines have acted as resistance and support since then. The regression channel and Fibonacci lines all point out to a 1447 resistance line that has held since early March.

Click for a larger picture
The parallel lines are a regression channel using a standard deviation of 1. The Fibonacci retracement originates at the lows of last August and retraces from the highs of December to the lows of January. All the retracement lines have acted as resistance and support since then. The regression channel and Fibonacci lines all point out to a 1447 resistance line that has held since early March.
Subscribe to:
Posts (Atom)