Given the market movement last week, it is not surprising that the list this week is limited to only 15 names since we screen for stocks within 95% of their 52 week high. This actually a feature of the list because in a down market there will be fewer names which will keep us in cash!
Once again, the top 10 are highlighted as the stocks are sorted by ascending Price-to-Sales ratio. I will use that list to rebalance the first list however, there are few survivors so this will be almost a complete turnover...
Here are the Combination Screen results for this week. This was not a great week as expectedly some people took some profits on the big winners and all the stocks on the list are at or close to their 52 week high.
2/1/2011 Screen
This is the original screen that is now 4 weeks old. I will not track this one on a weekly basis anymore as I had planned on rebalancing each screen after 4 weeks. But I will still check the results on a monthly basis for the next 5 months and see if the criteria have a long term impact on results.
This screen was hit the hardest this week, with the top 10 losing over 3%. The total screen is trailing the market over the last 4 weeks by 0.3%, but the top 10 are still up 3% more that the S&P for the last 4 weeks. Not too bad...
2/8/2011 Screen
I am tracking only the top 10% for the following screens. This screen was also hit hard last week. It still beats the market over the last 3 weeks, but barely.
2/15/2011 Screen
This screen did better than the 2 previous ones and is positive over 2 weeks while the S&P500 is in the red.
It is down to a couple big winners though!
2/21/2011 Screen
This is the screen from last week. This one did great last week but it is mostly due to the performance of PC Mall which is up 16% for the week. I guess sometimes it better to be lucky than good! The top 10% are down only 0.5% for the week when the overall market is down 3 times that.
This has not been a very satisfying experiment for a couple of reasons - the market is not cooperating with this screen by going up and secondly, I don't have much confidence in the screening parameters. I will keep on experimenting with it though to validate the current screen, but I will also be looking for other criteria to screen.
Screen from 2/15/2011
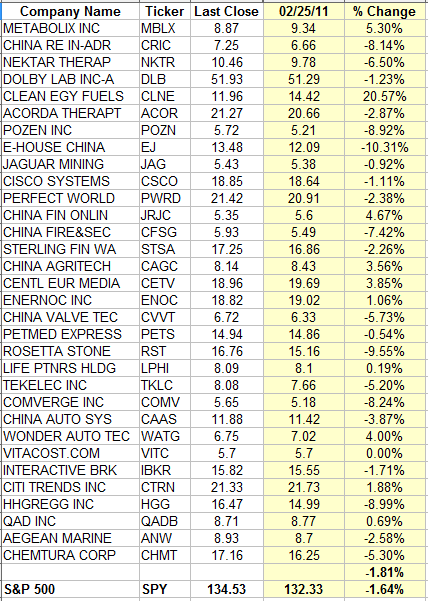
This was the first screen I ran. It trailed the market the previous week, but there were some big winners in the midst of the losers
History is repeating itself as the screen trails the market once again (not by much), but big winners spoil the party. CLNE for example is up over 20% for the week- no doubt a play on high oil prices. But there are other big movers... Over the last 2 weeks, the screen trails by around 0.6%.
Screen from 2/21/2011
Same story on this list. It trails the market, but big winners (CLNE was left over from the previous list).
I'll keep tracking both these lists for some more time and see if time ends taking its toll on these stocks.
And here is the latest list from the screen once again listed in descending order for the Price-to-Sales ratio,
Admittedly, by my own criteria, the bottom of the list where the Price-to-Sales ratio is below one could possibly be considered as undervalued. Might be some targets for bottom fishing as these stocks are certainly not expensive as compared to sales. I guess some more experimenting is needed!
Here is the list generated by my Stocks to Short screen. Based on the results from last week, I would very hesitant to short any of these stocks while the market is still rising as it is. The list did trail the market by 0.5% last week which is encouraging, but some of the stocks were big winner. It is always dangerous to short stocks as the bottom since the slightest bit of good news can generate an overreaction!
The stocks are ranked in descending order of Price-to-Sales. I'll track the results next week!
Here is the latest list from my combination screen. Once again, ranked by Price-to-Sales. I will track the performance of the top 10 only for this list.
There are 102 stocks in the list, but I list only the top 80 here... As the market makes new high, more and more stocks also make new high so the list is growing every week! The top 10 are highlighted in yellow. I will track these stocks over the next 4 weeks.
Time to update the screens for this week. I am now tracking 3 versions of the combination screens (one for each of the last 3 weeks) and I will also update the test screen of stocks to short. I will present the new list for the screen in another post later today.
January 31 List
To begin with, here is the first screen from 3 weeks ago. Since this is the original screen that I will rebalance on a monthly basis, I track the entire portfolio. For the other weekly list, I will track only the top 10 as ranked by the Price-to-Sales ratio since my testing has shown it to be the best criteria.
Over the last 3 weeks, the entire list is up 5.37% as opposed to 4.73% for the broader market as represented by SPY. The list was up 1.94% last week along as opposed to 1.07% for SPY. The top 10 (ranked by Price-to-Sales) is nothing short of great. Up 2.32% for the week and 9.44% over the last 3 weeks. It beats the market by over 4%. Next week is the last week for this entire list as I will rebalance the portfolio. I suspect that there will be some heavy turnover! But the goal is to maximize performance, not hold stocks for a long time!
February 7 List
The list created 2 weeks ago also had a good week. To save time, I am tracking only the top 10 for the weekly list. Last week, these 10 stocks were up 2.47%, beating the market by close to 1.5%. They are up 4.46% for the last 2 weeks, up close to 2% over SPY.
February 14 List
This week is only a week old. And once again, it beat the market pretty handily for the week, up 2.63% as compared to 1.07% for SPY.
There seem to be a pattern emerging here as newer list outperform the older list in perfect order. Something to track over the next months!
Stocks to Short List
Well, a rising tide lifts all boats... Even though I tried picking stocks that are close to their 52 weeks low ranked with descending Price-to-Sales ratio, the entire list did manage to stay positive. It did underachieve the broader market though by around 0.5%. This would be a better list to track in a correction. Unfortunately, none on the horizon so far....
That is is for the current screen... A very good week overall!
As an experiment, I want to see if the reverse criteria of my combination screen would create a nice list of stocks to short. So I have screened for stocks within 5% of their 52 weeks low, trading at more than $5 (I don't want penny stocks) and ranked them based on Price-to-Sales but in descending order in order to get the worse ones at the top. Here is the list for today:
I will track this portfolio as well over the coming weeks and run the screen every week!
I have tried to sort out the results from the lists generated the last 2 weeks by the Combination Screen and here are some thoughts. At first I tried combining all the fundamentals numbers into one rating and applying it to rank the stocks in the list. The first week, it generated results that beat that overall list but not by much. And it did not carry over to this week. I tried using a technical rating based on multiple technical indicators, but so far, I cannot find a correlation. Then I went back to the books that inspired the screen to begin with and remembered the fundamental criteria that was cited more often - Price-to-Sales. As an experiment, I ranked the stocks by the Price-to-Sales ratio in ascending order and analyzed the numbers. Not surprisingly (in hindsight), this makes a big difference! Here are the results:

After the first week, the top 10 stocks in the list (highlighted in yellow in the list) are up an average of 5.93% with only one loser. This beats the market by 3.83%. After 2 weeks, the top 10 are up 6.99%, beating the market by 3.36% so losing some ground. But it is expected after such results in the first week! Still some very big winners and only 2 losers (20%). Not bad...
Seeing the first week results, I went back to the list generated by the screen last week and ranked the stocks by their Price-to-Sales ratio again and again, they beat the market average.
The overall market was up by 1.49% last week, but the top 10 on the list were up 1.89%. Not as good as the first set of stocks, but still noticeable. But 3 losers out of the 10.
This is something worth monitoring over the long run! This is the reason why I listed the screen results for this week in ascending order of the Price-to-Sales ratio. I will keep on monitoring the results based on that criteria as well.
Also, the set of data generated by the screen is not representative enough to do a complete analysis so my plan now is to try to find a correlation between fundamental values and performance over 6 months to a year. I will generate a much larger list, track the performance and analyse the results on a monthly basis! More on this in a later post.
I have not been posting at all this week as I was sick! But back to the keyboard again.... Here is the list of stocks passing the screen criteria as of Friday. I have copied only the first 70 as the list now has over 80 names! I will have another post on some research I have done to screen out the best candidates later. This list is sorted on the Price-to-Sales ratio.
I ran a first screen using criteria described in a my first article on fundamentals on Monday. The results of the screen can be found in this post. At this point, it is just an experiment - there is no money riding on this one! But one week later, I wanted to check how it fared against a strong market this week. Here are the results:
Some big winners (KELYA, BGC and ARW) and also some losers. KEM lost some grounds on disapointing earnings this week for example! It's always risky to invest around earnings announcements, but this screen did not take earning dates into account so we'll live (and die) with that. Overall, the screen beats the market by 0.23%. Not a bad start...
I'll check again in one week and plan to rebalance every month. I will also setup other screens using some other criteria and screen described in other posts. I will track these as well.
In a previous post I outlined some fundamentals that you can screen for to look for quality stocks. That set of values was the one that stood out for me out of the 2 books that that mentioned. However, in his book (Your Next Great Stock ), Jack Hough outlines other factors that are sometimes ignored. Here are a couple more.
Accruals (from Free Cash Flow and Earnings)
Most investors are stuck on looking at earning, but as we saw in the last post, earning can be manipulated. In addition, earnings do not necessarily represent how much cash a company is adding to the kitty box due to the rules of accounting used by all businesses - accruals accounting. Under these rules, income is added as it is accrued (not when it is collected) and expenses are subtracted as they are incurred (not when they are paid). In his book, Hough uses the example of his barber who starts accepting credit cards - he might sell $2000 of services per week as usual, but if 1/2 his clients use credit cards to pay, he'll have only $1000 in his kitty box until he gets paid by the credit card company. But he can still count on $2000 of income. It gets trickier with large businesses depreciating and amortizing large equipment or software as payment are counted over many years even if made in one shot! Hough outlines ways that businesses can use accruals to boost their numbers. Obviously, something to always keep in mind. Next Hough outlines a strategy to look for something a bit counterintuitive - to look for companies with negative accruals. Accruals are calculated by subtracting free cash flow from earnings. His argument (supported by many studies) is that companies with negative accruals usually have hidden earnings while companies with positive accruals might actually be inflating earnings. He cites in particular a couple studies from Richard Sloan (an accounting professor at U. of Michigan) who found out that a portfolio which bought companies with negative accruals and shorted companies with positive accruals beat the broad market by 10% a year between 1962 and 1991. Sloan published another article supporting his research a couple years back and showed again that companies with high accruals showed poor earnings moving forward. Sloan's findings have been put to work by many institutional investors and hedge fund and they are now called the accrual anomaly. In 2006 Joshua Livnat (a professor at NYU) and Massimo Santicchia (of S&P Investment Services) found that the anomaly still yielded positives results despite the fact that large investors were actively trading using it. They also discovered that the accrual anomaly was stronger with smaller to mid-size companies. Now, accruals are not usually listed in most financial web site, but it can be calculated if your screener shows Free Cash Flow and Earnings. Hough suggests looking for companies whose trailing 12-month free cash flow minus trailing 12-month net income is greater than zero. In his screen he adds other factors, but feel free to add any of the factors described in the other post.
Insider Buying
Executives willing to eat their own cooking can be a decent predictor as long as you know what to look for. In his book, Hough goes to great length to explain insider buying. This is sometimes a tricky subject as the reasons for the buying are not always black and white - a canny executive might be accumulating shares to consolidate his position for example. But most often, they have a better understanding of their businesses than the public at large. Obviously, for them to trade on nonpublic information is illegal, but it is a gray area as to what is nonpublic! In any case, Hough outlines a study that was done by Citibank in 2006 on insider transactions done in the UK. The analysts were looking for factors that affected the stock price after that transactions took place. The factors were:
- Large stock purchases - Bigger purchases would predict better returns but purchases too large (as a percentage of the float) had actually the opposite effect.
- Who made the stock purchases - Executives has more impact than board members.
- Numbers of executives making a stock purchase
- Size of the companies - Stock purchases in smaller company with little analyst coverage did better.
- Timing - A stock purchase following an earning surprise was a good predictor. In addition, purchases made while a stock had a strong performance was usually a good sign.
Hough suggests looking for insider purchases of more than $100,000 but keeping the total shares purchased at less than 5% of the available shares. The number of insiders buying also has to be greater than 2. To keep with the results of the study, he also suggests looking for companies of less than $10 billion market value covered by less than 6 analysts.
Interestingly enough, Hough does not elaborate on insider selling. I would be curious to see if it has the reverse effect on the stock price! Maybe someone has published a study on that.
New screeners present you with a wealth of numbers - all the price ratios you can digest, earnings numbers, cash flows, and so on. It is becoming impossible to sort out though the ocean of information that companies release every quarter now. In addition, can you rely on analysts anymore? Apparently, bloggers do a better job of rating companies than street analysts!
Therefore it is becoming important to try to concentrate on the numbers that will have the most impact on future stock prices. I have picked up 2 books to help me screen the screener input:
Your Next Great Stock - Jack Hough
Jack Hough writes the screening analysis in Smart Money and SmartMoney.com. In this books, he outlines 11 different strategies using fundamental information.
Beat the Market - Invest by Knowing What Stocks to Buy and What Stocks to Sell - Charles D. Kirkpatrick II
Charles Kirkpatrick has written books on Technical Analysis and has perfected some screens described in the book. You can get more information at http://www.charleskirkpatrick.com/.
- Charles D. Kirkpatrick II
Charles Kirkpatrick has written books on Technical Analysis and has perfected some screens described in the book. You can get more information at http://www.charleskirkpatrick.com/.
Out of these 2 books, a couple of numbers have risen to the top. Here is a quick list:
Price-to-Sales
Both books rely on the price/sales ratio in some of their screens. It is used by Kirkpatrick in his most successful screen (the Bargain list) which is up 95% since December 30, 2005 to date. His Bargain portfolio is up 161% in the same period - Kirkpatrick advocates going to cash gradually during market downturns which he measure with MA crossings (a little complicated for this posting). In any case, not too shabby since the S&P500 is up only around 7% in the same period. In this screener, Kirkpatrick uses relative values for the price-to-sales ratio, comparing the ratio from one company to all others. He ran a lot of testing to arrive at the best range of relative values. Not that easy to screen for although one software contains custom screen created to match Kirkpatrick specifications - High Growth Stock Investor. Not cheap, but there is a trial period. Jack Hough keeps it simpler, screen for a Price-to-Sales ratio below 1.5. Easy enough! His screen contains other criteria (like Kirkpatrick's), but the Price/Sales ratio is the cornerstone. Both Hough and Kirkpatrick cite the work of O'Shaughnessy who ran some simulations and found that $10,000 invested in high Price/Sales ratio stocks would be worth $19,000 in 2003 while the same amount invested in low Price/Sales ration stocks would be worth $22 millions! Low Price/Sales stocks returned on average 16% a year. By adding requirements for earnings growth and price momentum, the simulation returns more than $53 millions by 2003. Pretty strong evidence I would say. The advantage of the Price/Sales ratio over say, the P/E ratio or any cash flow ratio is that it is difficult to manipulate - accountants can adjust earnings almost every quarters. Sales are sales...
Price Momentum
This seems like a natural, but too often, it feels wrong to invest in a company that has a great run! What if you caught a top. In his book, Hough cites some studies that have been done to show that investing in stocks that are within 5% of their 52 week high and selling stocks within 5% of their lows have beaten the market by an average of 7.8% per year. Compound that over 20 years and you can start planning for a nice retirement. Obviously, other factors should be used to weed out hyped up stocks, but the evidence is pretty strong. Kirkpatrick uses a relative strength percentile factor in his Bargain List portfolio, looking for stocks with a percentile greater than 97. He uses his own calculation to arrives at this number, but the thesis is similar. Better to buy stocks performing better than the average!
Earning Growth
There, the 2 books diverge - they both stress the importance of earning growth but Hough is forward looking while Kirkpatrick looks to the past. Kirkpatrick seems to have little faith in projected earnings (and who can blame him there) so he relies on his own relative calculations, using operating earnings over 4 quarters as compared to the 4 quarter total one quarter earlier. He uses operating earnings to get around adjustments and special charges that make it impossible to make accurate comparisons. He uses 4 quarters to get around the seasonality that could affect some businesses. The calculated ratio is then used to rank companies between 0 to 99. Interestingly enough, Kirkpatrick does not use this criteria in his best screen, relying solely on relative performance and Price/Sales. Hough in his book shows a little more faith in the system and describes a screen using the PEG ratio. He advocates a PEG ratio between 0.2 and 1.5. The cutoff at 0.2 is to weed out any special earning report such as settlement that would distort the earning picture. In his screen, Hough combines the PEG ratio with some price momentum criteria (see above). Obviously, the PEG ratio is only as good as the analysts predictions so it is important to use this criteria on companies that have wide enough coverage to get reliable figures. But he cites a screen from the AAII who has beaten the market pretty handily based on screening stocks for a PEG between 0.2 and 1.
Price-to-Book
This criteria does not appear in the Kirkpatrick book, but Hough makes a good argument for inclusion in his book. He cites the work of Joseph Piotrosky from the U. of Chicago who found that low P/B ratio stock beat the market by an average of 6% per year (which is confirmed by other studies). However, he also found that only 1/2 the stocks returned by the screen contributed to all the gains so he needed more criterias to weed out potential winners. He came out with 9 of them. I will not list them in this article (you can read the book) but the P/B ratio is the cornerstone of the screen. Hough advocates screening for companies whose P/B ratio is in the bottom 25% of the stock universe you are screening against. This is also one ratio that can vary greatly from one industry to another so this has to be taken into consideration.
In my opinion (as well as the 2 writers above), these criteria are amongst the most important ones to screen for. Hough uses others in other screens, but this will be the topic for another article. Good hunting!