
Friday, April 29, 2011
Copper - Regression Channel 4/29/2011
Copper is getting close to the lower limit of the regression channel it has been in since last June!

Wednesday, April 6, 2011
Silver - Resistance Line?
Here is an updated chart with the Fibonacci retracement. This is the same chart I posted yesterday and as predicted, silver is hedging closer to $40. The $39.60 Fibonacci line is holding for the moment, but weakness in the dollar should propel silver over that bar eventually.

Tuesday, April 5, 2011
Silver - Regression and Retracement
And here is a quick chart for silver

Quite the parabolic move for silver. Same overlay as the gold chart - regression channel with a standard deviation of 1 and a Fibonacci retracement from the lows of August to December and January! Silver has had a much better run than gold in the that timespan. There was some hesitation around the 50% line, but it has been a runaway train since then. Looks like the $40.00 line could be a target.

Click for a larger image
Quite the parabolic move for silver. Same overlay as the gold chart - regression channel with a standard deviation of 1 and a Fibonacci retracement from the lows of August to December and January! Silver has had a much better run than gold in the that timespan. There was some hesitation around the 50% line, but it has been a runaway train since then. Looks like the $40.00 line could be a target.
Gold - Regression and Retracement
A quick chart of gold to try guessing were we are going.

The parallel lines are a regression channel using a standard deviation of 1. The Fibonacci retracement originates at the lows of last August and retraces from the highs of December to the lows of January. All the retracement lines have acted as resistance and support since then. The regression channel and Fibonacci lines all point out to a 1447 resistance line that has held since early March.

Click for a larger picture
The parallel lines are a regression channel using a standard deviation of 1. The Fibonacci retracement originates at the lows of last August and retraces from the highs of December to the lows of January. All the retracement lines have acted as resistance and support since then. The regression channel and Fibonacci lines all point out to a 1447 resistance line that has held since early March.
Monday, April 4, 2011
Valuation - Aerospace Industry
This is the first of many posts about the valuations calculated by my method. I will post one industry at a time to make for better comparison. Obviously every company will have its own set of problems, but overall, ratios should be somewhat constant over an industry.
First in line is the Aerospace industry - it's first alphabetically...

Notable on this list are the big guys - BA, GD and LMT. 3 big defense contractors. All 3 are rated as cheap in general, but most specifically compared to sales and growth which are the most important factors. BA is close to a fair valuation in this estimate - the average being around $79 and it traded at $74 on Friday. Obviously the growth number is based on estimates so it is only as reliable as the estimates.
Also apparently undervalued are NOC, LLL and RTN. These 3 are undervalued on all criteria - sales, book and growth which would usually get you a spot in my combination screen when combined with some momentum.
Others like FLIR, GR and ERJ are currently expensive - between 11 and 31%. GR and FLIR are cheap relative to potential growth but expensive relative to book and sales. The closest valuation is GR. ERJ is really expensive relative to growth and cheap relative to sales.
Overall, a mixed bag!
First in line is the Aerospace industry - it's first alphabetically...
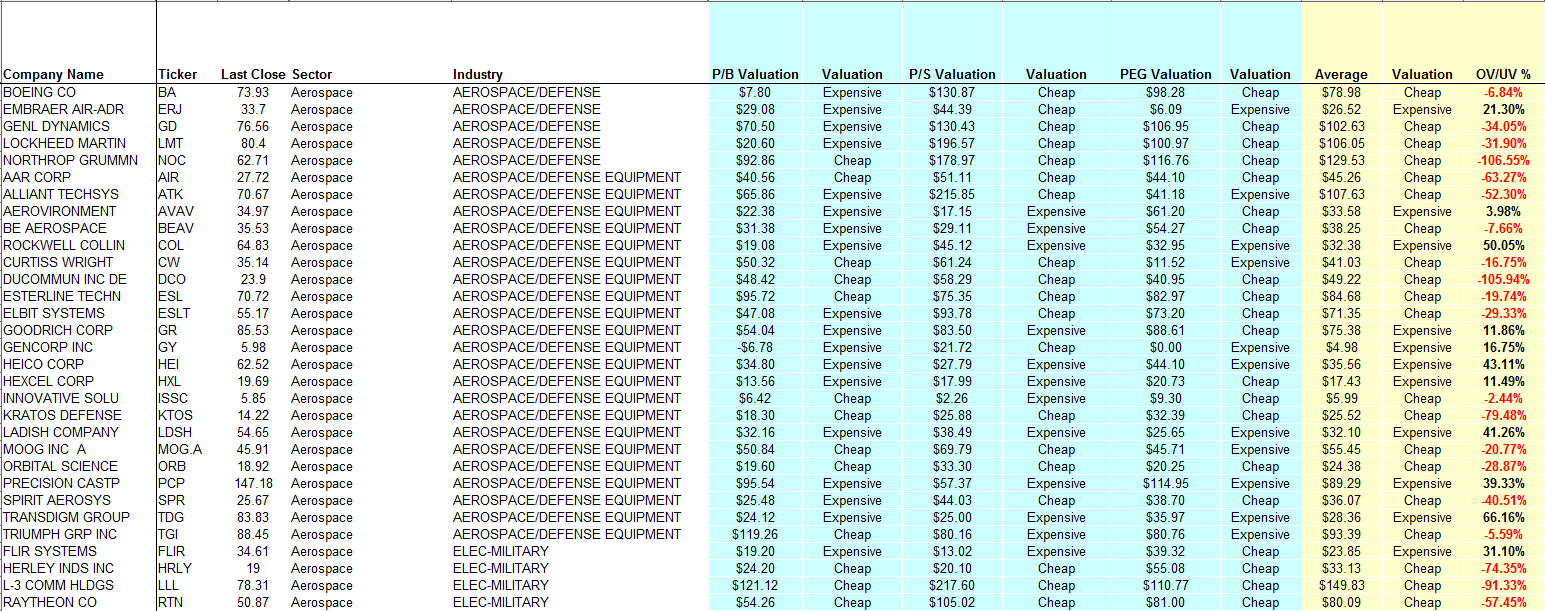
Click on the picture for a larger view.
Notable on this list are the big guys - BA, GD and LMT. 3 big defense contractors. All 3 are rated as cheap in general, but most specifically compared to sales and growth which are the most important factors. BA is close to a fair valuation in this estimate - the average being around $79 and it traded at $74 on Friday. Obviously the growth number is based on estimates so it is only as reliable as the estimates.
Also apparently undervalued are NOC, LLL and RTN. These 3 are undervalued on all criteria - sales, book and growth which would usually get you a spot in my combination screen when combined with some momentum.
Others like FLIR, GR and ERJ are currently expensive - between 11 and 31%. GR and FLIR are cheap relative to potential growth but expensive relative to book and sales. The closest valuation is GR. ERJ is really expensive relative to growth and cheap relative to sales.
Overall, a mixed bag!
Why is Oil going higher
Barchart.com has some neat charts and one of the most instructive is their Commitment of Traders chart. For example, looking at the Oil COT, we can see that over the past months, there has been a rush of managed money into the oil market fueling that rise in prices. Even retail investors are getting into the act as producers and swap dealers start getting out!
 This bears watching as prices should start dropping as soon as managed money starts leaving!

Sunday, April 3, 2011
Is this move for real? Part 2
I wanted to follow up on that post with updated charts. Since the last charts, some averages have caught up while one in particular has opened up a wide gap - DIA. It is safe to say that for that index, the last week's move looks a little fake as it was not confirmed by volume. Volume on the other hand seems to confirm the IWM move! We'll see how that pans out over the next couple of days!


DIA
SPY
QQQ
IWM
Valuation Spreadsheet - 4/3/2011
I have updated my valuation spreadsheet online. It can be viewed at the following link.
More information on the valuation criteria can be found here.
I have added closed to 1000 tickers to the list. It should now contain all the optionable stocks in the US markets. There might be some errors as the data source is not always up to date in that regard! There are also some holes in the valuation in particular to the ones that relate to growth as some companies don't have enough analyst's predictions for an accurate number. This will generally results in a valuation of $0.00. This is not ideal, but I have to work with the data provided.
In addition, I have tried to rank the stocks using my valuation, some momentum criteria and other more proprietary values. The Top 10 in that list are:

The Average column list the average valuation between the book, sales and growth valuation. All these stocks are currently undervalued in this model. I'll track these over the next couple of weeks and see what kind of results I get!
More information on the valuation criteria can be found here.
I have added closed to 1000 tickers to the list. It should now contain all the optionable stocks in the US markets. There might be some errors as the data source is not always up to date in that regard! There are also some holes in the valuation in particular to the ones that relate to growth as some companies don't have enough analyst's predictions for an accurate number. This will generally results in a valuation of $0.00. This is not ideal, but I have to work with the data provided.
In addition, I have tried to rank the stocks using my valuation, some momentum criteria and other more proprietary values. The Top 10 in that list are:
The Average column list the average valuation between the book, sales and growth valuation. All these stocks are currently undervalued in this model. I'll track these over the next couple of weeks and see what kind of results I get!
Combination Screen - 4/1/2011 Results
Another good week for the combination screen. The 10 stocks beat the broader market index by 0.4% gaining 1.8% for the week. After 9 weeks, the portfolio is up almost 11.50%, beating the S&P500 3 to 1. I have to admit that I am surprised by the results, but the market has been very helpful to bullish bets!

I have updated the old weekly picks but I will now treat them as long time experiment to see how long an effect the criteria have.
For example, the original 10 stocks picked on 1/31/2011 are still up strong after 9 weeks! Not doing quite as well as the portfolio that I rebalance every 4 weeks, but still beating the market by a wide margin.

I'll post results for all the screens later this week. But so far, not one of the weekly list is trailing the broader market average. This seems to validate the criteria. But more testing is still needed.
The candidates for this week's list are:

As usual, I will select only the top 10 as ranked by price-to-sales for my weekly list.

I have updated the old weekly picks but I will now treat them as long time experiment to see how long an effect the criteria have.
For example, the original 10 stocks picked on 1/31/2011 are still up strong after 9 weeks! Not doing quite as well as the portfolio that I rebalance every 4 weeks, but still beating the market by a wide margin.
I'll post results for all the screens later this week. But so far, not one of the weekly list is trailing the broader market average. This seems to validate the criteria. But more testing is still needed.
The candidates for this week's list are:
As usual, I will select only the top 10 as ranked by price-to-sales for my weekly list.
Subscribe to:
Comments (Atom)